White paper 06 · Climate
Lower-carbon steel from Cameroon: it could reach a third of the world’s carbon intensity
On Cameroon’s grid an electric steelworks could emit far below global averages; verified measurement becomes an advantage under CBAM.
Derived Counted from the English manuscript when the site was generated; print equivalent = words ÷ 350.
You are reading the full English edition. Also online: Édition française complète中文摘要版
Executive summary
What the study shows
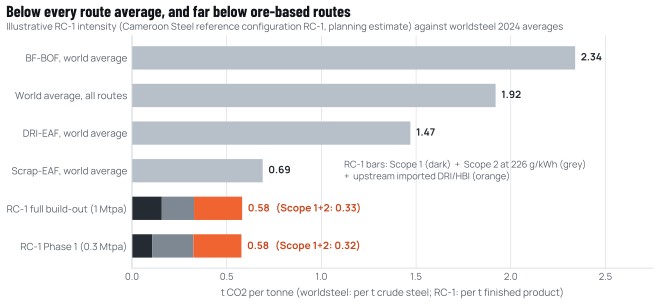
Read the full executive summaryAn electric-arc steelworks on Cameroon’s hydro-dominated grid could make steel at about 0.3 t CO₂ per tonne within Scopes 1 and 2 (direct emissions and purchased electricity) and about 0.6 t including imported iron units, on our estimates. Carbon border measures can turn that estimated advantage, once measured and verified, into a competitive asset against ore-based steel, and Central Africa’s ore and hydropower give it a long-term green-iron option.
Source: white paper 06, executive summary; bracketed markers refer to the list of sources in the annex.
Main findings
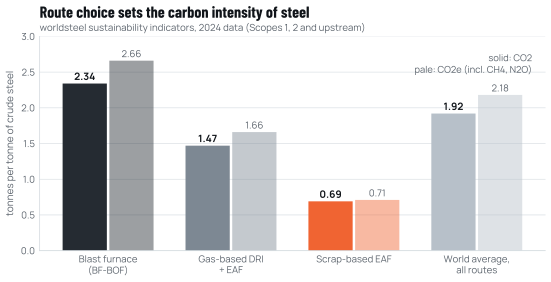
- Route choice, not effort at the margin, sets the carbon intensity of steel. Steel accounts for about 7% to 8% of global greenhouse gas emissions [S02]. On worldsteel’s 2024 data, the blast-furnace route emits 2.34 t CO2 per tonne of crude steel, gas-based direct reduction with an electric furnace 1.47 t and scrap-based electric furnaces 0.69 t, for a world average of 1.92 t [S01]. Africa already makes 89% of its crude steel in electric furnaces [S03].
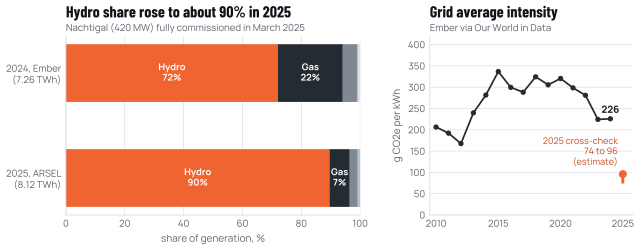
- Cameroon’s grid is about half as carbon-intensive as the world’s. The average intensity of Cameroon’s electricity was about 226 g CO2e/kWh in 2024, against 471 g for the world and 717 g for South Africa [S48]. Hydropower supplied about 72% of generation in 2024 on the Ember dataset and, on the regulator’s dataset, about 90% in 2025 after the 420 MW Nachtigal plant was fully commissioned [S49][S50]; the two datasets differ in coverage. Applying the 2024 fossil emission rate to the 2025 mix suggests an average of about 74 to 96 g/kWh (derived, indicative). 226 g/kWh is therefore conservative against the average, but not against the marginal factor: until the Nachtigal evacuation line and the southern grid are reinforced, new load at Kribi may be served at the margin by gas or oil plants at about 770 g/kWh, which would add up to about 0.5 t per tonne in the hours when thermal plants are on the margin (derived).
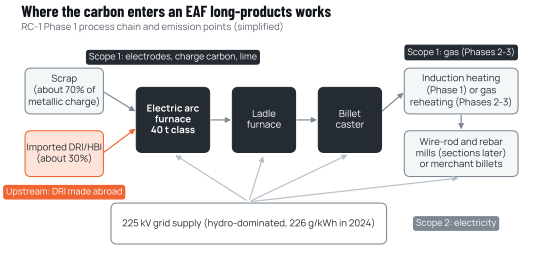
- The illustrative footprint of the first phase is about 97,000 t of CO2 a year within Scopes 1 and 2. At its nameplate of 0.3 Mtpa, RC-1 Phase 1 would emit about 31,900 t directly on site (Scope 1) and about 65,300 t through purchased grid electricity, emitted at the power plants (Scope 2). Minor sources outside the model (diesel for mobile plant, LPG and SF6 in switchgear) would add about 3,000 to 7,000 t (assumed). Imported direct-reduced iron or hot-briquetted iron (DRI/HBI) adds about 76,200 t upstream. At the expected sustained output of 270,000 to 300,000 t a year, the annual totals are up to 10% lower and the intensities unchanged. At the 1 Mtpa design capacity the figures are about 328,000 t (Scopes 1+2) and 582,000 t including upstream iron units; intensity stays close to 0.33 and 0.58 t per tonne. With the furnace at the upper planning value of about 490 kWh per tonne for a charge with 30% DRI, rather than 450, each intensity rises by about 0.01 t (derived from the RC-1 reference configuration).
- The iron units the furnace melts matter more than any other single choice. Moving the imported DRI share of the charge from 30% to 50% adds about 0.18 t per tonne; cutting it to 20% saves about 0.09 t. The upstream intensity of that DRI (0.5 to 0.9 t per tonne of DRI) moves the result by about 0.07 t either way, and the grid factor (200 to 300 g/kWh) by −0.03 to +0.07 t. Taken one at a time, these ranges keep the Phase 1 intensity between about 0.49 and 0.75 t per tonne; at their joint extremes it spans about 0.42 to 0.95 t (derived).
- The advantage belongs to the grid as much as to the furnace. The same melt shop on a world-average grid would emit about 0.81 t per tonne including upstream iron units, and about 1.05 t on South Africa’s grid. On this full-footprint basis it would lose its lead over the average scrap-based electric furnace at a grid factor of about 340 g/kWh (derived). Firm, contracted low-carbon power is therefore a carbon decision, not only an energy decision.
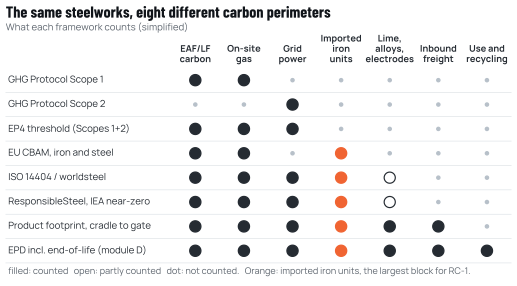
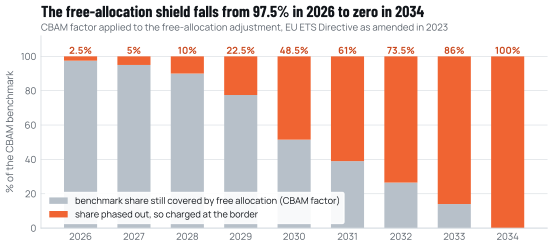
- One plant can honestly report seven different numbers. Depending on the perimeter, the same Phase 1 tonne carries about 0.11 t (Scope 1 only), 0.11 t (Scopes 1+2 with a market-based hydro supply contract), 0.20 t (Scopes 1+2 at the 2025 grid cross-check of 96 g/kWh), 0.32 t (Scopes 1+2 at the 2024 grid average), 0.36 t (EU CBAM basis, which for steel counts direct and precursor emissions but not purchased electricity), 0.54 t (per tonne of crude steel on the ISO 14404 and worldsteel basis) or 0.58 t (the same, per tonne of product). Credibility depends on stating the perimeter every time and on third-party verification.
Contents
12 chapters, 4 annexes
Every chapter opens with its conclusion. The annexes set out the method, the glossary and the list of sources.
- SummaryExecutive summary: a low-carbon start that only measurement can turn into an asset13 min · 1 fig.
- Chapter 1Steel and climate: the route decides11 min · 3 fig.
- Chapter 2Accounting carbon in steel: state the perimeter every time12 min · 2 fig.
- Chapter 3The grid factor: Cameroon’s hydropower is the electric works’ largest advantage11 min · 3 fig.
- Chapter 4An illustrative footprint: about 0.3 t within Scopes 1 and 2, about 0.6 t with imported iron14 min · 5 fig.
- Chapter 5Carbon border measures: verified low intensity becomes a price advantage12 min · 3 fig.
- Chapter 6Green iron: a long-term option for Central Africa, gated by ore, power and gas13 min · 4 fig.
- Chapter 7Climate risk and adaptation: a plateau site with a wet, warming climate and an eroding port coast11 min · 3 fig.
- Chapter 8Circularity: scrap is the cleanest input, and slag and dust are resources11 min · 3 fig.
- Chapter 9Finance and standards: lenders, buyers and certifiers will ask for proof11 min · 2 fig.
- Chapter 10A decarbonisation pathway: about 40% lower with known levers, further with green iron11 min · 2 fig.
- Chapter 11Evidence gaps: what is not yet known, and how it will be resolved5 min
Annexes
Go further
Related white papers
- WP05Cameroon’s hydro grid can power low-carbon steel if large users get firm supply, clear tariffs and gasEnergy · 2.9 h
- WP03Electric steelmaking is the right route for Central AfricaTechnology · 2.9 h
- WP07Building responsibly in Kribi: a steelworks can meet international standards on four conditionsEnvironment and society · 2.8 h
Related Labs tools
- Carbon and CBAM calculator
What is the footprint of a tonne of steel, and what would it cost at the EU border?
- Steel route lab
Which steelmaking route uses the least energy and emits the least CO₂?
- Power demand
How much electricity does an electric steelworks need, hour by hour?
Cite this white paper
CS-WP-06
Cameroon Steel (2026). Lower-carbon steel from Cameroon: it could reach a third of the world’s carbon intensity. White paper 06, CS-WP-06. https://www.cameroon-steel.com/en/library/lower-carbon-steel/
- Reference
- CS-WP-06
- Edition
- 10 October 2026
- Status
- First edition
- Classification
- Public