White paper 06 · Chapter 2
Accounting carbon in steel: state the perimeter every time
The carbon intensity of a tonne of steel is not a single fact about a plant; it is the result of a counting rule applied to that plant. The same RC-1 tonne can honestly be reported at seven different values, from about 0.11 to 0.58 t of CO2, depending on which emissions are counted and per tonne of what. The standards that matter to Cameroon Steel’s lenders, buyers and regulators are now well defined. The discipline that follows is simple: choose the standard that fits the purpose, state its perimeter, and have the figure verified.
In this chapter (8)
- 2.1 The GHG Protocol sorts emissions into three scopes
- 2.2 ISO 14404 and the worldsteel method compare sites on a common boundary
- 2.3 Product footprints and environmental product declarations follow the product, not the site
- 2.4 Regulators and lenders each draw their own perimeter
- 2.5 One plant, seven defensible numbers
- 2.6 Per tonne of what? The denominator matters
- 2.7 Market-based electricity claims need evidence, especially on a hydro grid
- 2.8 Why this matters commercially
2.1 The GHG Protocol sorts emissions into three scopes
Most corporate carbon accounting rests on the Greenhouse Gas Protocol, developed by the World Resources Institute and the World Business Council for Sustainable Development [S45]. It sorts emissions by who controls their source.
- Scope 1 covers direct emissions from sources the company owns or controls. For an electric-arc works, these are the CO2 from graphite electrodes and charge or injection carbon that oxidise in the furnace, from the carbonate share of fluxes such as lime and dolomite, and from any fuel burnt on site, such as natural gas in a reheating furnace.
- Scope 2 covers the emissions from generating the electricity, steam or heat the company buys. For an electric-arc works this is usually the largest category within Scopes 1 and 2, although the emissions occur at the power plants rather than on site. The Protocol’s 2015 guidance requires two figures: a location-based figure, which uses the average emission factor of the grid the plant draws from, and a market-based figure, which uses the emission factor of the electricity the company has contracted for, evidenced by contractual instruments [S45].
- Scope 3 covers all other indirect emissions in the value chain, upstream (purchased goods, transport of inputs) and downstream (processing, use and end-of-life of products).
For steel, one Scope 3 category is so large that sector methods treat it separately: the upstream emissions of purchased iron-bearing intermediates such as coke, pellets, pig iron and DRI. A plant that buys DRI rather than making it moves the emissions of ironmaking out of its own Scope 1 and into someone else’s. Comparing that plant’s Scopes 1 and 2 with an integrated works that makes its own iron would flatter it unfairly. Sector methods therefore add the upstream emissions of purchased intermediates back in, so that plants with different degrees of integration can be compared on a like-for-like basis.
2.2 ISO 14404 and the worldsteel method compare sites on a common boundary
The ISO 14404 series, built on the CO2 data collection methodology of the World Steel Association, gives the steel industry’s standard method for calculating the CO2 intensity of a steel site [S41][S42][S43]. Part 1 covers plants with a blast furnace and Part 2 plants with an electric-arc furnace, both in second editions published in 2024; Part 3 covers plants with an electric-arc furnace and a coal-based or gas-based direct-reduction facility (2024); Part 4 (2020) gives guidance on using the series, including a universal calculation sheet covering all routes.
The method has three features that matter for a works like RC-1:
- A fixed site boundary. All processes from raw-material handling to hot rolling are inside it, with defined treatment of auxiliary units such as oxygen plants and lime kilns.
- Upstream emissions for purchased intermediates. Purchased DRI, pig iron, pellets, coke, lime and oxygen carry standard or supplier-specific upstream emission factors, so that buying an intermediate does not reduce the reported intensity.
- Credits for exported by-products and energy. Slag sent to cement making or exported electricity can earn a credit, because they displace emissions elsewhere.
The result is expressed per tonne of crude steel (cast steel), the denominator used by worldsteel in its route averages [S01]. worldsteel has collected site data on this basis from its members for many years, and the IEA reviewed the series alongside the worldsteel methods and the ResponsibleSteel standard in its 2023 report on emissions measurement for a net-zero steel industry, recommending convergence towards a common method [S07].
2.3 Product footprints and environmental product declarations follow the product, not the site
Construction clients, specifiers and public buyers increasingly ask not for a site intensity but for the footprint of the product they buy, documented in an environmental product declaration (EPD). Product footprints follow ISO 14067 [S46]; EPDs for construction products follow ISO 14025 and, in Europe, the core rules of EN 15804+A2 [S47].
A cradle-to-gate EPD (modules A1 to A3) counts everything from raw-material extraction to the factory gate: the site’s direct emissions, its electricity, the upstream emissions of every purchased input (iron units, ferroalloys, electrodes, lime, refractories, gases) and inbound transport. EN 15804 also requires a separate module D, which reports the benefit of recycling the steel at the end of its life. worldsteel’s life cycle inventory, whose 2024 dataset was released in May 2026 with global and regional data for 16 products including reinforcing bar and sections, follows ISO 14040 and 14044 and is compatible with ISO 14067 and EN 15804 [S44].
Product footprints are larger than site intensities because they count more inputs, and they are expressed per tonne of the declared product rather than per tonne of crude steel. They are the figures a buyer will compare with competing products and enter into a building’s embodied-carbon calculation.
2.4 Regulators and lenders each draw their own perimeter
Three regulatory or contractual perimeters matter most for RC-1.
The EU Carbon Border Adjustment Mechanism prices the "embedded emissions" of imported goods. For iron and steel, aluminium and hydrogen, Annex II of the CBAM Regulation provides that only direct emissions are taken into account, including the direct emissions embedded in precursors such as DRI or pig iron; the emissions of the electricity used are monitored and reported but not priced [S27]. A scrap-and-DRI electric works on a hydro grid therefore has a CBAM perimeter that excludes its purchased electricity, its largest category within Scopes 1 and 2, but includes the full direct emissions of the DRI it buys. The same rule explains why an all-scrap furnace carries a smaller CBAM charge than RC-1, even though RC-1’s total footprint on Cameroon’s grid is lower than that of the average scrap-based furnace (Chapter 5).
The Equator Principles (EP4) use Scopes 1 and 2 combined to set their climate requirements: a climate change risk assessment, including an alternatives analysis, for projects expected to emit more than 100,000 t CO2e a year, and annual public reporting above the same threshold [S22]. IFC Performance Standard 3 requires quantification above 25,000 t a year [S21].
Certification schemes and definitions for low-emission steel, such as the IEA’s near-zero threshold, ResponsibleSteel’s progress levels, the Global Steel Climate Council’s standard and Germany’s Low Emission Steel Standard, count Scopes 1 and 2 and upstream emissions of purchased intermediates, with differences in detail [S06][S37][S39][S40]. Chapter 9 discusses their thresholds.
Figure 2.1 summarises which emission sources each perimeter counts.
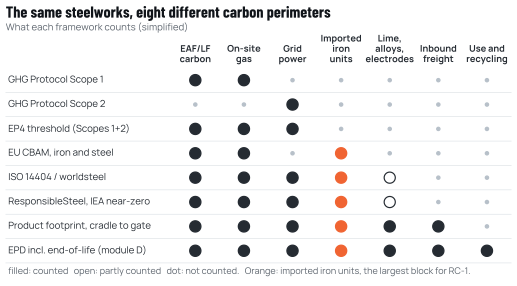
Source: GHG Protocol [S45]; Equator Principles EP4 [S22]; Regulation (EU) 2023/956, Annex II [S27]; ISO 14404 series [S41][S43]; ResponsibleSteel [S37]; IEA [S06]; ISO 14067 [S46]; EN 15804+A2 [S47]. Simplification by Cameroon Steel.
Table 2.1 The main standards and perimeters compared
| Framework | Purpose | Boundary | Denominator | Electricity | Purchased iron units | Status for RC-1 |
|---|---|---|---|---|---|---|
| GHG Protocol, Scopes 1 and 2 | Corporate inventory | Operational or financial control | Absolute, t CO2e per year | Scope 2, location- and market-based | Scope 3 | Inventory from first heat |
| Equator Principles EP4 | Lender due diligence | Scopes 1 and 2 | Absolute, above 100 kt | Included | Excluded | Applies from Phase 1 |
| IFC Performance Standard 3 | Lender standard | Project | Absolute, above 25 kt | Included | Excluded | Applies |
| ISO 14404 / worldsteel | Site intensity, benchmarking | Site, with upstream and credits | Per t crude steel | Included | Included (upstream) | Primary reporting basis |
| EU CBAM (iron and steel) | Border charge | Installation, with precursors | Per t of good | Reported, not priced | Included (direct of precursor) | For any EU-bound tonne |
| ISO 14067 / EPD (EN 15804+A2) | Product claims, procurement | Cradle to gate (A1 to A3), module D separate | Per t declared product | Included | Included, with all other inputs | For construction buyers |
| IEA near-zero, ResponsibleSteel, GSCC, LESS | Definitions, certification | Scopes 1 and 2 with upstream | Per t crude steel or product | Included | Included | Benchmark for progress |
Source: as for Figure 2.1; GSCC [S39]; LESS [S40]; IEA [S07].
2.5 One plant, seven defensible numbers
Figure 2.2 applies these perimeters to the illustrative RC-1 Phase 1 footprint developed in Chapter 4. None of the numbers is wrong; each answers a different question.
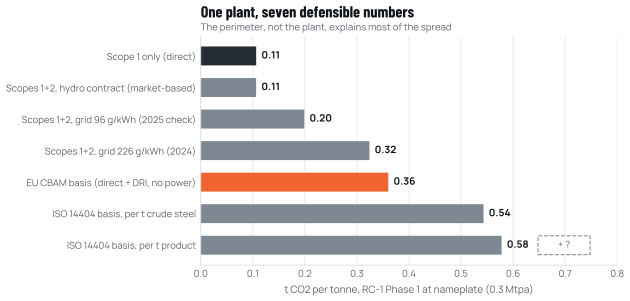
Source: WP06 model on the Cameroon Steel reference configuration RC-1 (planning estimate) [S90]; grid factors from Ember via Our World in Data [S48] and ARSEL [S50]; CBAM perimeter from Regulation (EU) 2023/956 [S27].
Reading from the smallest:
- About 0.11 t (Scope 1 only). The furnace’s own emissions: electrodes, charge carbon and lime. This is what the plant emits through its stacks in Phase 1, when billets are reheated by induction rather than gas.
- About 0.11 t (Scopes 1 and 2, market-based, hydro contract). If Cameroon Steel buys electricity under a contract backed by identified hydro generation, the GHG Protocol allows a market-based Scope 2 at the contracted source’s emission factor, which is zero on a combustion basis. This figure is only as credible as the contract and the evidence behind it (Chapter 3).
- About 0.20 t (Scopes 1 and 2 at 96 g/kWh). The location-based figure if the grid factor falls to the level suggested by the 2025 generation mix (derived, indicative; Chapter 3).
- About 0.32 t (Scopes 1 and 2 at 226 g/kWh). The location-based figure at the published 2024 grid average. This is the conservative planning value used throughout this paper.
- About 0.36 t (EU CBAM basis). Direct emissions plus the direct emissions of the purchased DRI, without electricity; the DRI’s full upstream factor is used as its embedded direct emissions, a conservative simplification. It exceeds the Scopes 1 and 2 figure because the DRI it adds weighs more than the electricity it removes.
- About 0.54 t (ISO 14404 basis, per tonne of crude steel). Scopes 1 and 2 plus the upstream emissions of the purchased DRI, per tonne of liquid steel cast. This is the figure to compare with worldsteel route averages.
- About 0.58 t (same, per tonne of finished product). The same emissions divided by the smaller tonnage of rolled product, since about 6% of the liquid steel is lost as crop ends, scale and rejects between the caster and the finished bundle.
2.6 Per tonne of what? The denominator matters
The last two numbers illustrate a frequent source of confusion. worldsteel route averages, the IEA near-zero threshold and ResponsibleSteel’s progress levels are expressed per tonne of crude steel. CBAM embedded emissions and EPDs are expressed per tonne of the declared good. For a long-products works the difference is the yield from caster to finished product, about 0.94 in RC-1 [S90]. Table 2.2 sets out the RC-1 figures on both bases.
Table 2.2 RC-1 illustrative intensities on the two denominators (t CO2 per tonne)
| Perimeter | Phase 1, per t crude steel | Phase 1, per t product | 1 Mtpa, per t crude steel | 1 Mtpa, per t product | Status |
|---|---|---|---|---|---|
| Scope 1 | 0.100 | 0.106 | 0.148 | 0.157 | derived |
| Scope 2 at 226 g/kWh | 0.205 | 0.218 | 0.160 | 0.170 | derived |
| Scopes 1 and 2 | 0.305 | 0.324 | 0.308 | 0.328 | derived |
| Upstream imported DRI/HBI | 0.239 | 0.254 | 0.239 | 0.254 | derived |
| Scopes 1 and 2 plus upstream DRI | 0.543 | 0.578 | 0.547 | 0.582 | derived |
| EU CBAM basis (direct and precursor) | 0.339 | 0.360 | 0.387 | 0.411 | illustrative |
Source: WP06 model on the Cameroon Steel reference configuration RC-1 (planning estimate) [S90] (Annex A). The 1 Mtpa Scope 1 is higher because Phases 2 and 3 reheat billets with natural gas; its Scope 2 per tonne is lower for the same reason.
In this paper, RC-1 figures are per tonne of finished product unless stated otherwise, and comparisons with crude-steel benchmarks are flagged. Using the product basis against crude-steel benchmarks overstates RC-1 by about 6%, so the comparisons are conservative.
2.7 Market-based electricity claims need evidence, especially on a hydro grid
The difference between the location-based and market-based Scope 2 figures (0.32 against 0.11 t in Figure 2.2) is large enough to deserve caution. On a grid where most electricity is already hydro, a contract that "allocates" hydro output to one customer does not by itself reduce the grid’s emissions; it can simply move low-carbon electricity on paper from other customers. The GHG Protocol’s quality criteria require that contractual instruments be unique, traceable, matched in time and drawn from the same market [S45], and buyers and certifiers increasingly look for evidence that the contracted supply is additional or at least that it is not double-counted. We have not identified a national registry of electricity attribute certificates in Cameroon for this paper, and Cameroon has no mandatory industrial greenhouse gas reporting regime of which we are aware. Its updated nationally determined contribution targets a 35% reduction in emissions below business as usual by 2030, 12% unconditionally [S80], and its Plan National Climat was approved in July 2025 [S81].
Cameroon Steel’s position is therefore to report the location-based figure as the primary Scope 2 number, to report a market-based figure only where a bilateral contract with an identified plant and metered delivery supports it, and to show both. A supply contract that brings new low-carbon capacity onto the grid, or that ties the works to a specific plant through the dry season, would strengthen both figures.
2.8 Why this matters commercially
Accounting rules may seem a technical matter, but for an exporting steelworks they translate directly into money and market access. Under CBAM, an importer that cannot document actual embedded emissions must use default values, which for many origins assume blast-furnace-like intensities and carry mark-ups that rise to 30% from 2028 (Chapter 5). Public buyers in several markets now award points or set ceilings on embodied carbon, which they assess from EPDs. Lenders apply thresholds to Scopes 1 and 2. A works that can produce verified numbers on every perimeter will be able to sell its low intensity; one that cannot will be assumed to be average, or worse.
The next chapter turns to the parameter that most affects Scope 2, and therefore the Scopes 1 and 2 numbers, for an electric works in Cameroon: the emission factor of the grid.
Sources cited in this chapter
Bracketed markers refer to these sources; the full list is in the annex. Full list of sources
- S45GHG Protocol Corporate Standard (2004) and Scope 2 Guidance (2015). World Resources Institute and WBCSD, 2004; 2015.ghgprotocol.org/corporate-standard
- S41ISO 14404-1:2024 and ISO 14404-2:2024, Calculation method of carbon dioxide emission intensity from iron and steel production, Parts 1 and 2. International Organization for Standardization, Sep 2024.iso.org/standard/88111.html
- S42ISO 14404-3:2024, Part 3: Steel plant with electric arc furnace and coal-based or gas-based direct reduction iron facility. International Organization for Standardization, 2024.iso.org/standard/85990.html
- S43ISO 14404-4:2020, Part 4: Guidance for using the ISO 14404 series. International Organization for Standardization, 2020.iso.org/standard/77622.html
- S01Sustainability Indicators 2025 report (2024 data; route table added February 2026). worldsteel, Nov 2025; upd. Feb 2026.worldsteel.org/wider-sustainability/sustainability-indicators/
- S07Emissions Measurement and Data Collection for a Net Zero Steel Industry. International Energy Agency, 2023.iea.org/reports/emissions-measurement-and-data-collection-for-a-net-ze…
- S46ISO 14067:2018, Greenhouse gases: carbon footprint of products. International Organization for Standardization, 2018.iso.org/standard/71206.html
- S47ISO 14025:2006, Environmental labels and declarations, Type III; EN 15804:2012+A2:2019, core rules for construction products. ISO; European Committee for Standardization (CEN), 2006; 2019.iso.org/standard/38131.html
- S44Life cycle inventory data and eco-profiles. worldsteel.worldsteel.org/steel-topics/life-cycle-thinking/life-cycle-inventory-d…
- S27Regulation (EU) 2023/956 establishing a carbon border adjustment mechanism, Annexes I and II. Official Journal of the EU, L 130, 16 May 2023.eur-lex.europa.eu/legal-content/EN/TXT/PDF/?uri=CELEX:32023R0956
- S22The Equator Principles EP4. Equator Principles Association, Jul 2020 (effective 1 Oct 2020).equator-principles.com/app/uploads/The-Equator-Principles_EP4_July2020…
- S21Performance Standards on Environmental and Social Sustainability. IFC, 1 Jan 2012.ifc.org/en/insights-reports/2012/ifc-performance-standards
- S06Achieving Net Zero Heavy Industry Sectors in G7 Members. International Energy Agency, 19 May 2022.iea.blob.core.windows.net/assets/c4d96342-f626-4aea-8dac-df1d1e567135/…
- S37The Decarbonisation Progress Levels. ResponsibleSteel, 23 Sep 2024.responsiblesteel.org/resources/the-decarbonisation-progress-levels
- S39The Steel Climate Standard. Global Steel Climate Council.globalsteelclimatecouncil.org/the-standard/
- S40Germany introduces new green steel certification standard (Low Emission Steel Standard). EUROMETAL, Apr 2024.eurometal.net/germany-introduces-new-green-steel-certification-standar…
- S90Cameroon Steel reference configuration RC-1 (planning estimate): phases, planning values, balances and indicative schedule, edition 10 October 2026. Cameroon Steel, 10 Oct 2026.Cited by title and date
- S48Carbon intensity of electricity generation (Ember data). Our World in Data, dataset accessed 10 Oct 2026.ourworldindata.org/grapher/carbon-intensity-electricity
- S50Rapport d’activités 2025 de l’ARSEL. ARSEL (electricity regulator, Cameroon), 7 Sep 2026.arsel-cm.org/wp-content/uploads/2026/09/Rapport-ARSEL-2025.pdf
- S80Cameroon’s updated NDC sets 35% conditional emission cut target for 2030. Enerdata, 2021.enerdata.net/publications/daily-energy-news/cameroons-updated-ndc-sets…
- S81Arrêté n° 106/PM du 11 juillet 2025 portant approbation du Plan National Climat. Prime Minister of Cameroon (MINEPDED), 11 Jul 2025.minepded.gov.cm/wp-content/uploads/2025/08/decret-PM-plan-climat-1.pdf
Cite this chapter
Cameroon Steel (2026). Lower-carbon steel from Cameroon: it could reach a third of the world’s carbon intensity. White paper 06, chapter 2: Accounting carbon in steel: state the perimeter every time. CS-WP-06. https://www.cameroon-steel.com/en/library/lower-carbon-steel/accounting-carbon/
Source