Labs · control room
The site computes. You check.
Ten instruments put ten concrete questions to our own numbers: how much material for 300,000 t of rebar, which route emits least, how much electricity hour by hour.
100 MWKribi 225 kV line and substation, initial capacitySourced
15-minute peak: 47 MW, 47% of the initial 100 MWDerived
Demonstration running. Move the control to take over.
t/yr
Planning value: 300,000 t/yr. Drag, or use the arrow keys: every figure is recomputed.
300,000 tfinished products÷0.94casting and rolling yield=319,149 tliquid steel
319,149 t × 520 kWh/tarc furnace, ladle furnace, auxiliaries+300,000 t × 410 kWh/trolling, induction reheating=289 GWha year÷8,000 hoperating hours=36.1 MWon average
Each tool rests on a tested model, shows its assumptions and their sources, and produces a link you can share.
- Live
Value-chain explorer
≈ 176 kt
of ore a year if the DRI were one day made from Cameroonian ore (a later stage); Phase 1 melts scrap and imported DRI Illustrative
How many tonnes go in and out at each stage, from ore to finished product?
- Live
Carbon and CBAM calculator
≈ €21/t
indicative CBAM charge in 2030, against €131/t for blast-furnace steel Illustrative
What is the footprint of a tonne of steel, and what would it cost at the EU border?
- Live
Power demand
47 MW
15-minute average peak in Phase 1, for 36.1 MW on average over 8,000 hours Derived
How much electricity does an electric steelworks need, hour by hour?
- Live
Rebar estimator
≈ 40 t
of reinforcement for a 4-storey block of 250 m² per floor Illustrative
How much steel does my building need, and in which bar sizes?
- Live
Import-substitution simulator
412,049 t
of steel imported in 2025 (HS chapter 72), against 182,890 t in 2019 Sourced
What share of steel imports could local production replace?
- Live
Jobs impact
450–550
direct jobs planned in Phase 1 (planning range), plus about 1,000 indirect jobs Assumption
How many direct, indirect and induced jobs by phase?
- Live
Logistics simulator
~245
truckloads a day in and out at full capacity, if everything moved by road Derived
How many ships, trucks and trains does the plant need?
- Live
Careers pathfinder
13
steelworks trades ranked by your interests, level and preferred setting; 10 families, from furnace to office Illustrative
Which steel career suits me, and which training should I follow in Cameroon?
- Live
Project timeline
8
verified, dated milestones, kept apart from 2 reported statements and 9 objectives Sourced
What is verified, what is planned, and when?
Method
How an instrument is built
A tool is only worth what it lets you check. All ten instruments follow the same contract, from calculation to display.
- A pure, tested model
- Every calculation is a function independent of the interface, checked by automated tests: conservation of mass in the value chain, monotonicity, exact return to the values published by worldsteel, daily energy equal to annual energy.
- Visible assumptions
- Every coefficient appears in a table with its value, range, status and source. Default values reproduce the RC-1 reference configuration used throughout the site, so tools and pages never contradict each other.
- A plain-language result
- A sentence answers the question and updates with every change; screen readers announce it. Key figures, a chart and an equivalent table come with it, together with a method note.
- A link that keeps your settings
- Inputs are written into the page address: copy the link to share exactly your case, print the page, or export the result as CSV.
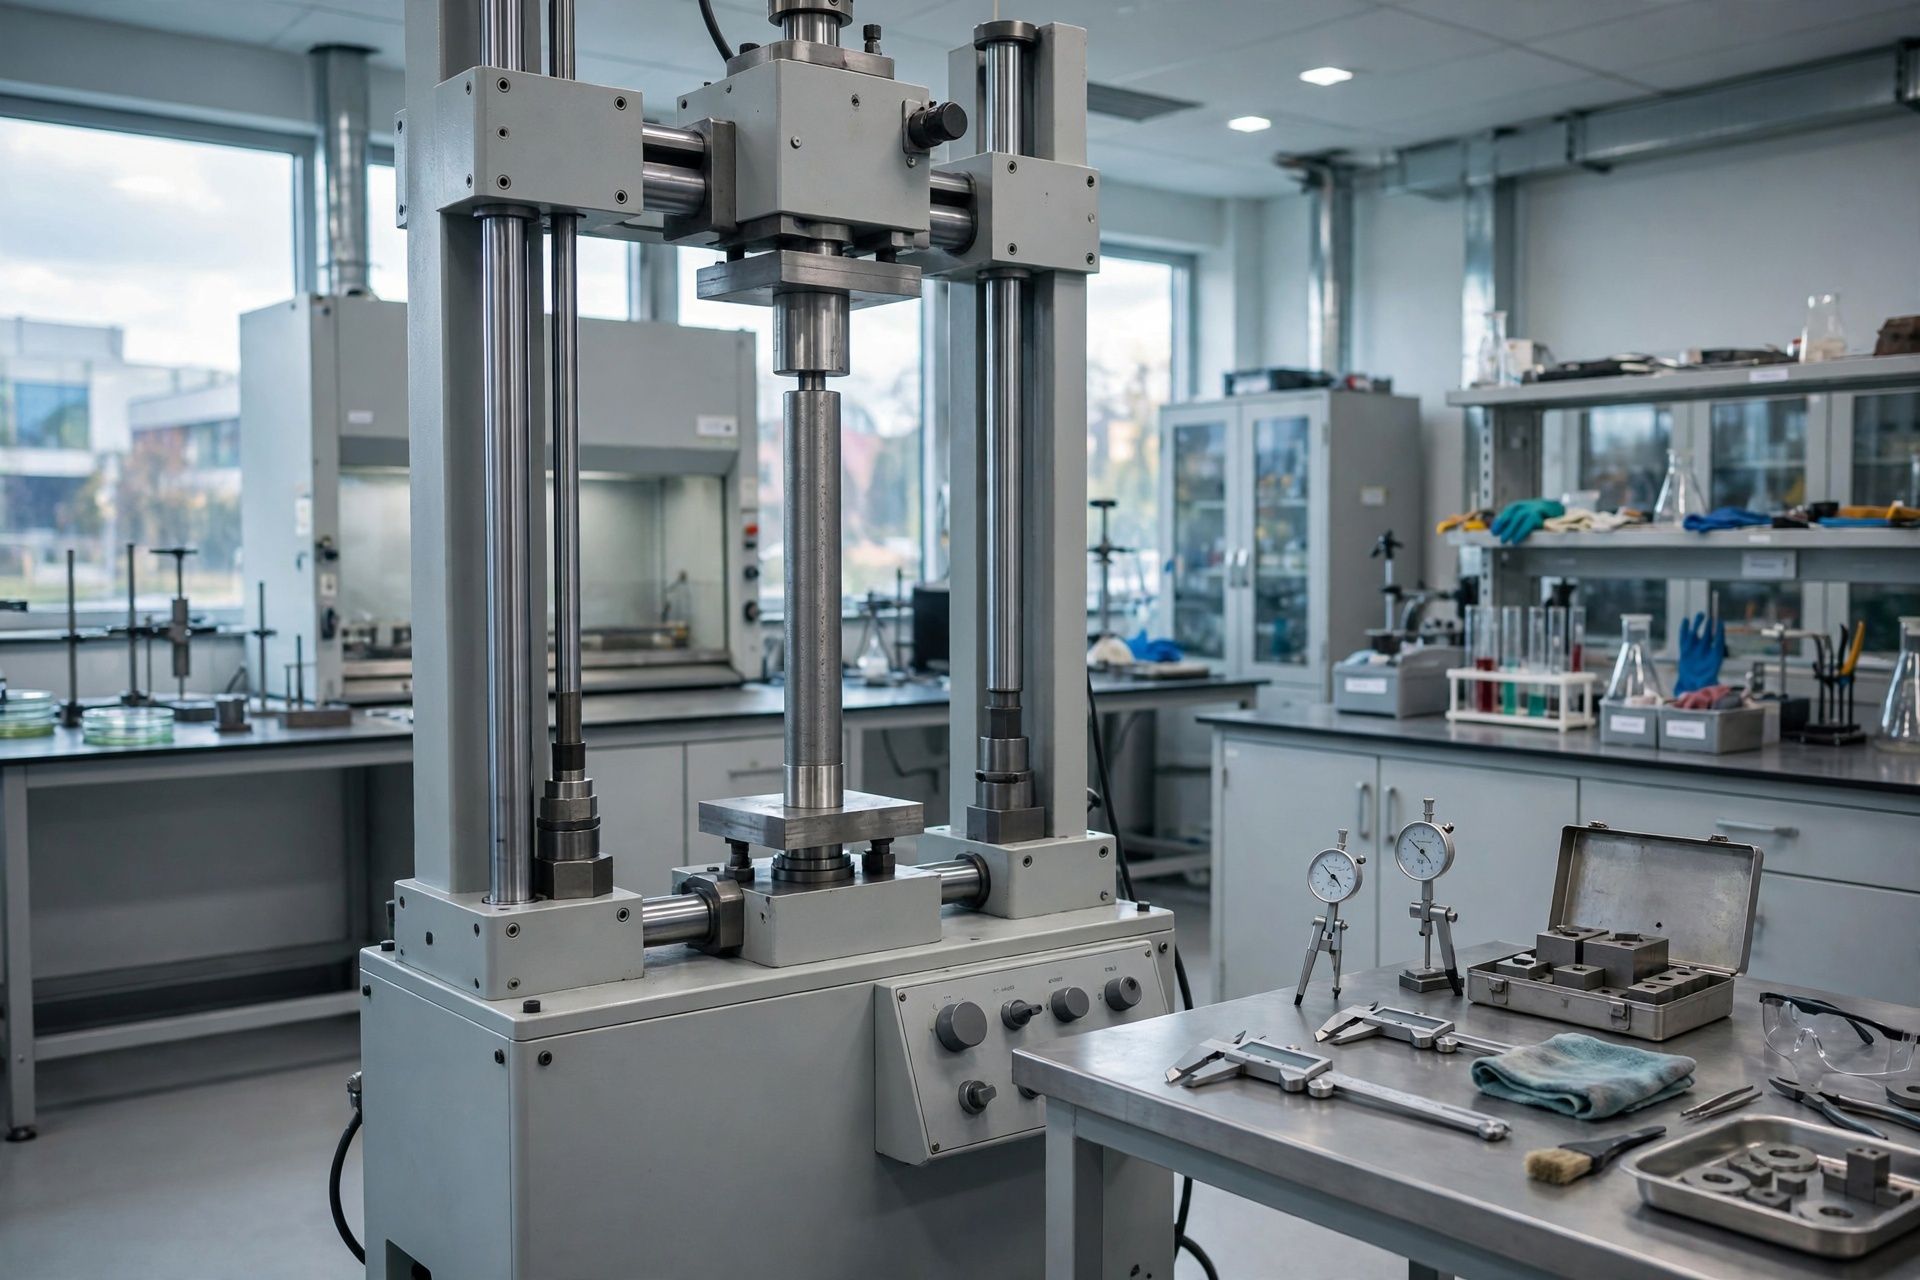
What the tools are not: commercial offers, engineering studies or tax advice. Their results are indicative; they will be replaced by verified measurements once the plant operates.
Vocabulary
Four statuses, the same everywhere
- Sourced
- A figure published by an identified, dated source: worldsteel, the International Energy Agency, INS Cameroun, ARSEL, the Port Autonome de Kribi.
- Derived
- A result computed from sourced figures by a stated method, such as Phase 1 annual electricity or the ore required.
- Assumption
- A planning value chosen within a published range, to be confirmed by engineering, permits or operation.
- Illustrative
- A value chosen to make the tool readable; it does not describe the project and can be changed freely.
Click the status of any figure, anywhere on the site, to see its source.
Go further
The white papers detail every assumption; the sources page lists every reference.