Air
Electric-furnace fumes will be captured and filtered in baghouses, under continuous monitoring, within the IFC EHS limits for steel. In the first phase, induction billet heating would avoid burning any gas.
Climate and environment
The route matters more than anything else in steel’s carbon footprint. An electric furnace on a hydro-dominated grid would put the project among the lowest-carbon options, provided it is measured, verified and published.
Choose a scope, then a column: the reading line gives its value, its basis and its source.
Scope of the count
Demonstration: changing the scope
t CO₂ per tonne of steel
World average, all routes 1.92 Sourced
The route averages leave the scale: they are published only with upstream materials included.
Blast furnace and converter
Iron ore is reduced with coke, then refined in an oxygen converter.
2.34t CO₂ per tonne of crude steel
worldsteel average: ironmaking and upstream materials are counted.
Project planning value, on the closest basis: ≈ 0.58
Source: worldsteel, Sustainability Indicators 2025 (2024 data) ↗
Not compared on this scope
worldsteel publishes this average with upstream materials included. Our sources give no figure for Scopes 1 and 2 alone, so we do not draw one.
Direct reduction and electric furnace
Iron ore is reduced in the solid state, then melted in an electric arc furnace.
1.47t CO₂ per tonne of crude steel
worldsteel average: ironmaking and upstream materials are counted.
Project planning value, on the closest basis: ≈ 0.58
Source: worldsteel, Sustainability Indicators 2025 (2024 data) ↗
Not compared on this scope
worldsteel publishes this average with upstream materials included. Our sources give no figure for Scopes 1 and 2 alone, so we do not draw one.
Scrap and electric furnace
Recycled scrap is melted in an electric arc furnace.
0.69t CO₂ per tonne of crude steel
worldsteel average: ironmaking and upstream materials are counted.
Project planning value, on the closest basis: ≈ 0.58
Source: worldsteel, Sustainability Indicators 2025 (2024 data) ↗
Not compared on this scope
worldsteel publishes this average with upstream materials included. Our sources give no figure for Scopes 1 and 2 alone, so we do not draw one.
Cameroon Steel, Phase 1
Scrap and imported reduced iron, melted in an electric arc furnace, then rolled.
≈ 0.58≈ 0.32t CO₂ per tonne of finished product
Planning values, to be replaced by verified measurements once the plant operates.Not comparable with route averages, which count upstream materials.
226 g CO₂/kWh: the 2024 factor of the Cameroon grid, kept as a conservative planning value. Ember, Our World in Data ↗
Closest basis, not an identical one. worldsteel averages are given per tonne of crude steel and also count the upstream of some purchased inputs, such as lime and oxygen; the project value is given per tonne of finished product and leaves those out.Scopes 1 and 2 cover emissions on site and from purchased electricity. The upstream of imported reduced iron stays outside this scope: it is drawn as a dashed outline.
Move the grid factor yourself in the Steel route lab →What makes the footprint
Worldwide, producing a tonne of crude steel emits 1.92 t of CO₂ on average. The average hides very large differences between routes: a coke-fired blast furnace emits three times as much as a scrap-fed electric furnace.
The electric arc furnace melts its metallic charge with electricity. Its footprint therefore depends mainly on two factors: the type of iron used (scrap, direct-reduced iron, pig iron) and the carbon intensity of the electricity. In 2024 hydropower supplied about 72% of Cameroon’s electricity, and the grid emitted an average of 226 g of CO₂ per kWh (Ember). ARSEL reports about 90% hydropower for 2025: our calculations keep the more prudent 2024 factor until a 2025 factor is published.
Our indicative estimate, built from International Finance Corporation ranges for the furnace and rolling, RC-1 assumptions for the rest and that 2024 factor, puts the steelworks at about 0.58 t of CO₂ per tonne once the upstream emissions of imported direct-reduced iron are included: that is the closest basis to world averages, which include ironmaking and, unlike our estimate, the upstream of some purchased inputs such as lime and oxygen. Scopes 1 and 2 alone come to about 0.32 t in Phase 1 (about 0.33 t at full build-out), a figure that does not compare with those averages. A more hydro-based grid would lower the electricity share further. These estimates will be replaced by verified measurements once the plant operates.
Sourced Sources: worldsteel, Sustainability Indicators 2025 (2024 data); Ember, carbon intensity of electricity and generation by source, 2024 (via Our World in Data); ARSEL, 2025 activity report; Cameroon Steel, RC-1 reference configuration (indicative calculation).
2.34 · 1.47 · 0.69t CO₂/t
Global average CO₂ intensity: blast furnace, DRI plus electric furnace, scrap plus electric furnace
Source
worldsteel, Sustainability Indicators 2025 (2024 data)
worldsteel.org/wider-sustainability/sustainability-indicator
~90%
Hydropower share of Cameroon’s electricity generation in 2025 according to ARSEL (about 72% in 2024 according to Ember, the year of the 226 gCO₂/kWh factor this site uses)
Source
ARSEL, Rapport d’activités 2025, 7 Sep 2026
arsel-cm.org/wp-content/uploads/2026/09/Rapport-ARSEL-2025.p
~0.58t CO₂/t
Indicative intensity including upstream imported DRI: the closest basis to route averages. Scopes 1 and 2 alone: about 0.32 t in Phase 1 (0.33 t at full build-out)
Source
Cameroon Steel reference configuration RC-1: electricity per tonne (IFC ranges for the furnace and rolling; RC-1 assumptions for induction heating and auxiliaries) × Cameroon grid factor 226 gCO₂/kWh (Ember, 2024, when hydropower supplied about 72%; ARSEL reports about 90% for 2025: the 2024 factor is kept as the prudent value); direct emissions and upstream of imported DRI at 0.70 t CO₂ per tonne of DRI (gas-based shaft furnace) are RC-1 assumptions
One series, three readings
Carbon intensity by route
t CO₂ per tonne of steel
Different bases: worldsteel averages per tonne of crude steel, ironmaking included (Sustainability Indicators 2025, 2024 data); Cameroon Steel per tonne of finished product, RC-1 estimate for Phase 1 with the 2024 grid factor (226 g CO₂/kWh). The figure with upstream (0.58) is the closest basis to the route averages, which also count the upstream of some purchased inputs (lime, oxygen) that RC-1 leaves out; Scopes 1 and 2 alone are about 0.32 in Phase 1 and 0.33 at full build-out.
| Blast furnace and converter (world average) | 2.34 | Sourced |
|---|---|---|
| Direct reduction and electric furnace (world average) | 1.47 | Sourced |
| Scrap and electric furnace (world average) | 0.69 | Sourced |
| Cameroon Steel, Phase 1, including upstream imported DRI (closest basis) | 0.58 | Derived |
| Cameroon Steel, Phase 1, Scopes 1 and 2 only: excluding upstream, not comparable | 0.32 | Derived |
Different bases: worldsteel averages per tonne of crude steel, ironmaking included (Sustainability Indicators 2025, 2024 data); Cameroon Steel per tonne of finished product, RC-1 estimate for Phase 1 with the 2024 grid factor (226 g CO₂/kWh). The figure with upstream (0.58) is the closest basis to the route averages, which also count the upstream of some purchased inputs (lime, oxygen) that RC-1 leaves out; Scopes 1 and 2 alone are about 0.32 in Phase 1 and 0.33 at full build-out.
| Phase 1 (0.3 Mt) | 30 | Illustrative |
|---|---|---|
| Phases 1 and 2 (0.5 Mt) | 32 | Illustrative |
| Full capacity (1 Mt) | 34 | Illustrative |
Illustrative: for steel, CBAM covers direct emissions and those of precursors (including imported DRI), not purchased electricity (Regulation (EU) 2023/956). RC-1 intensity × €82.32/t CO₂, before deduction of EU free allocation and any carbon price already paid.
| Phase 1 (0.3 Mt) | 173 | Derived |
|---|---|---|
| Phases 1 and 2 (0.5 Mt) | 290 | Derived |
| Full capacity (1 Mt) | 582 | Derived |
RC-1 calculation: Scope 1 (combustion, electrodes, lime), Scope 2 (electricity, 2024 grid factor of 226 g/kWh), upstream imported DRI.
The carbon border adjustment
Since 1 January 2026 the European Union has applied the definitive regime of its Carbon Border Adjustment Mechanism (CBAM) to imports of steel, direct-reduced iron, billets and reinforcing bar. Certificates go on sale only from 1 February 2027; for 2026 imports, the obligation is priced at the quarterly average EU carbon price: €82.32 per tonne of CO₂ in the third quarter of 2026.
Cameroon Steel’s priority markets are Cameroon and Central Africa, which CBAM does not cover. But a verified footprint for every tonne is becoming something financiers and buyers ask for everywhere. We are preparing for it from the design stage.
Sourced Sources: Regulation (EU) 2023/956; European Commission (DG TAXUD), CBAM definitive regime and price of CBAM certificates, third-quarter 2026 price published on 5 October 2026.
Environment
These are design objectives: the impact assessment will set the values, and compliance will be measured and published.
Electric-furnace fumes will be captured and filtered in baghouses, under continuous monitoring, within the IFC EHS limits for steel. In the first phase, induction billet heating would avoid burning any gas.
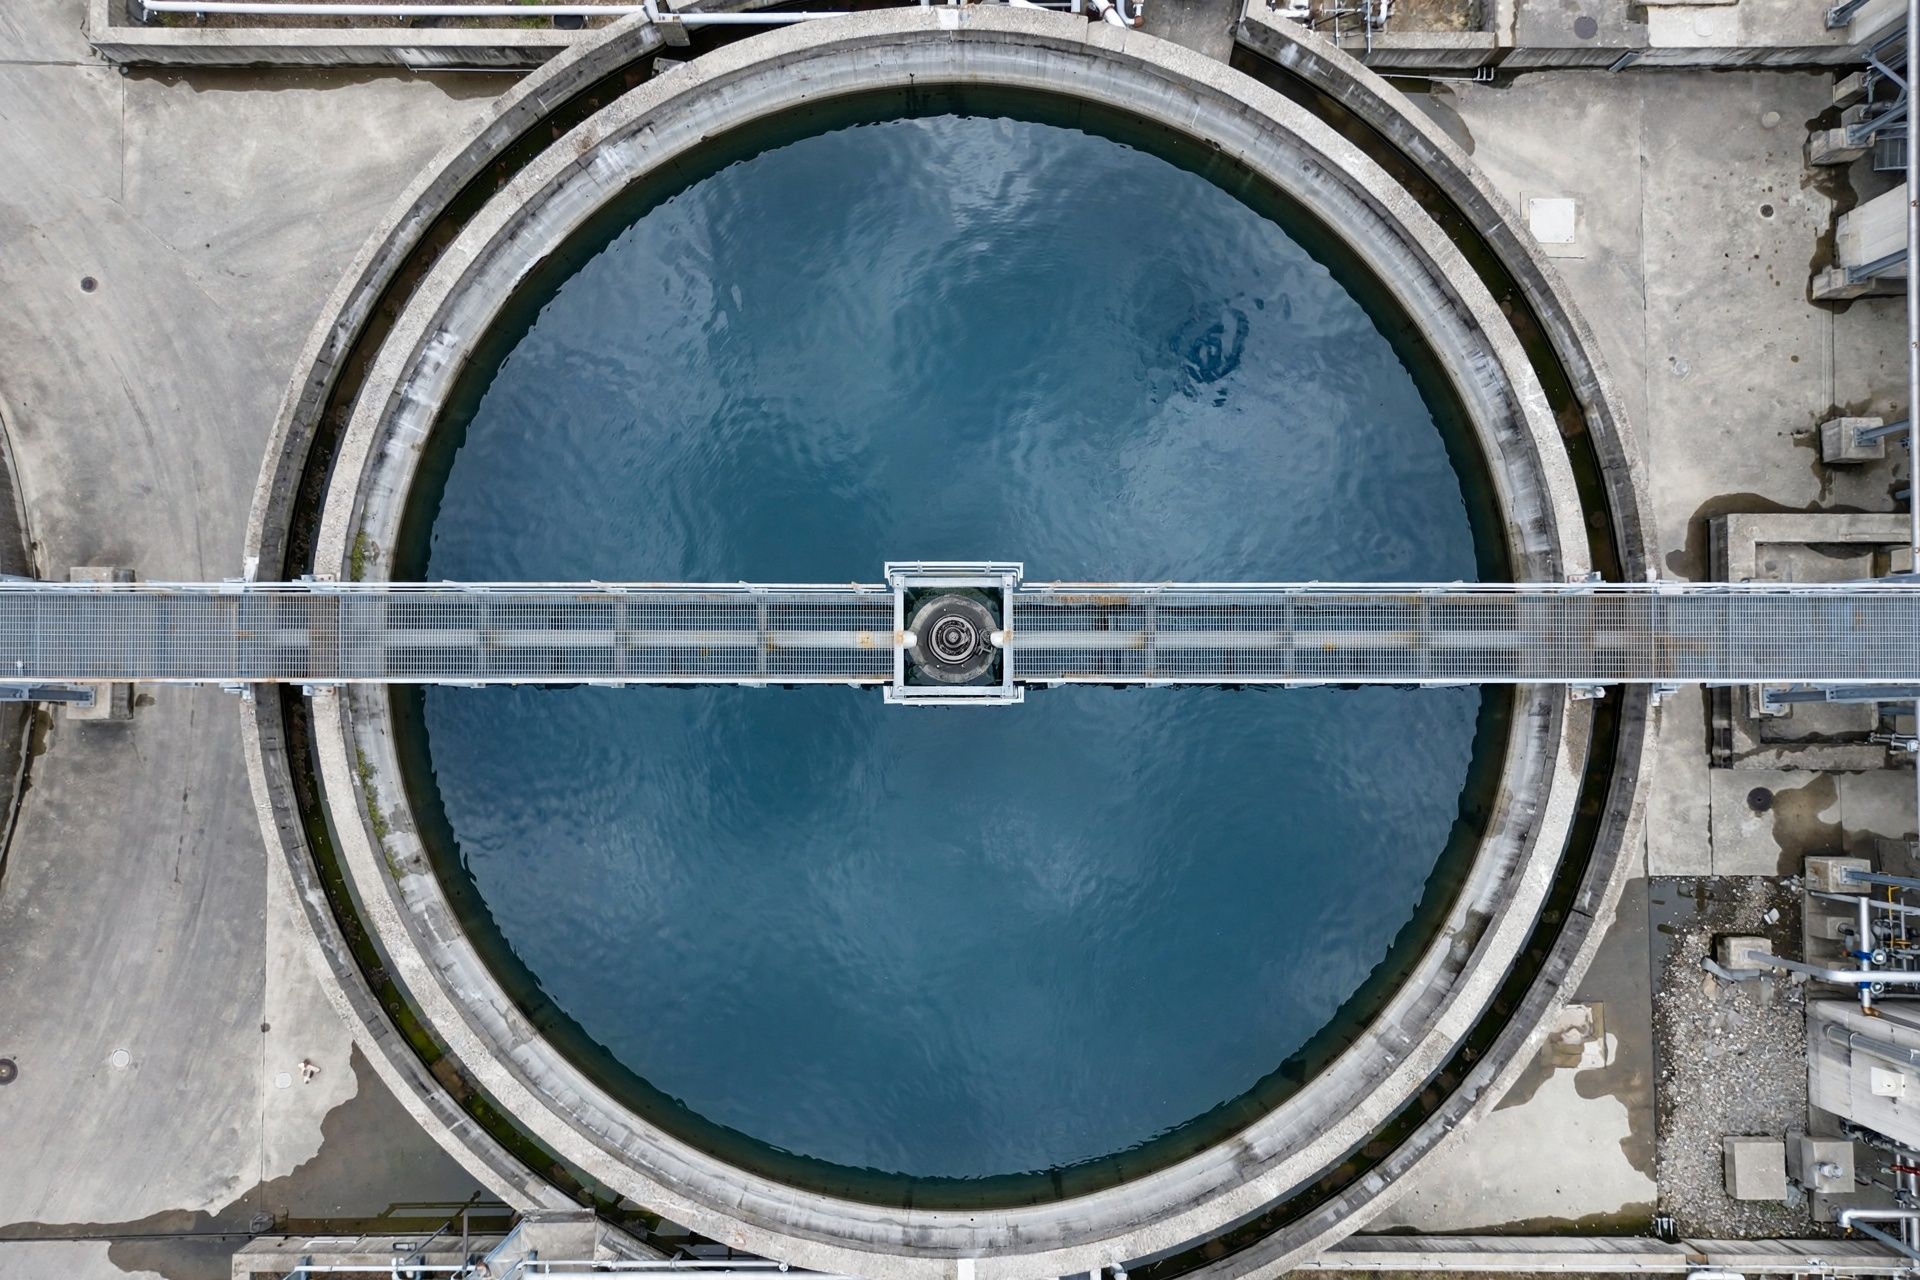
The design provides for closed cooling circuits, rainwater harvesting (about 2,800 mm a year in Kribi), effluent treatment and retention basins sized for the 100-year rainfall.
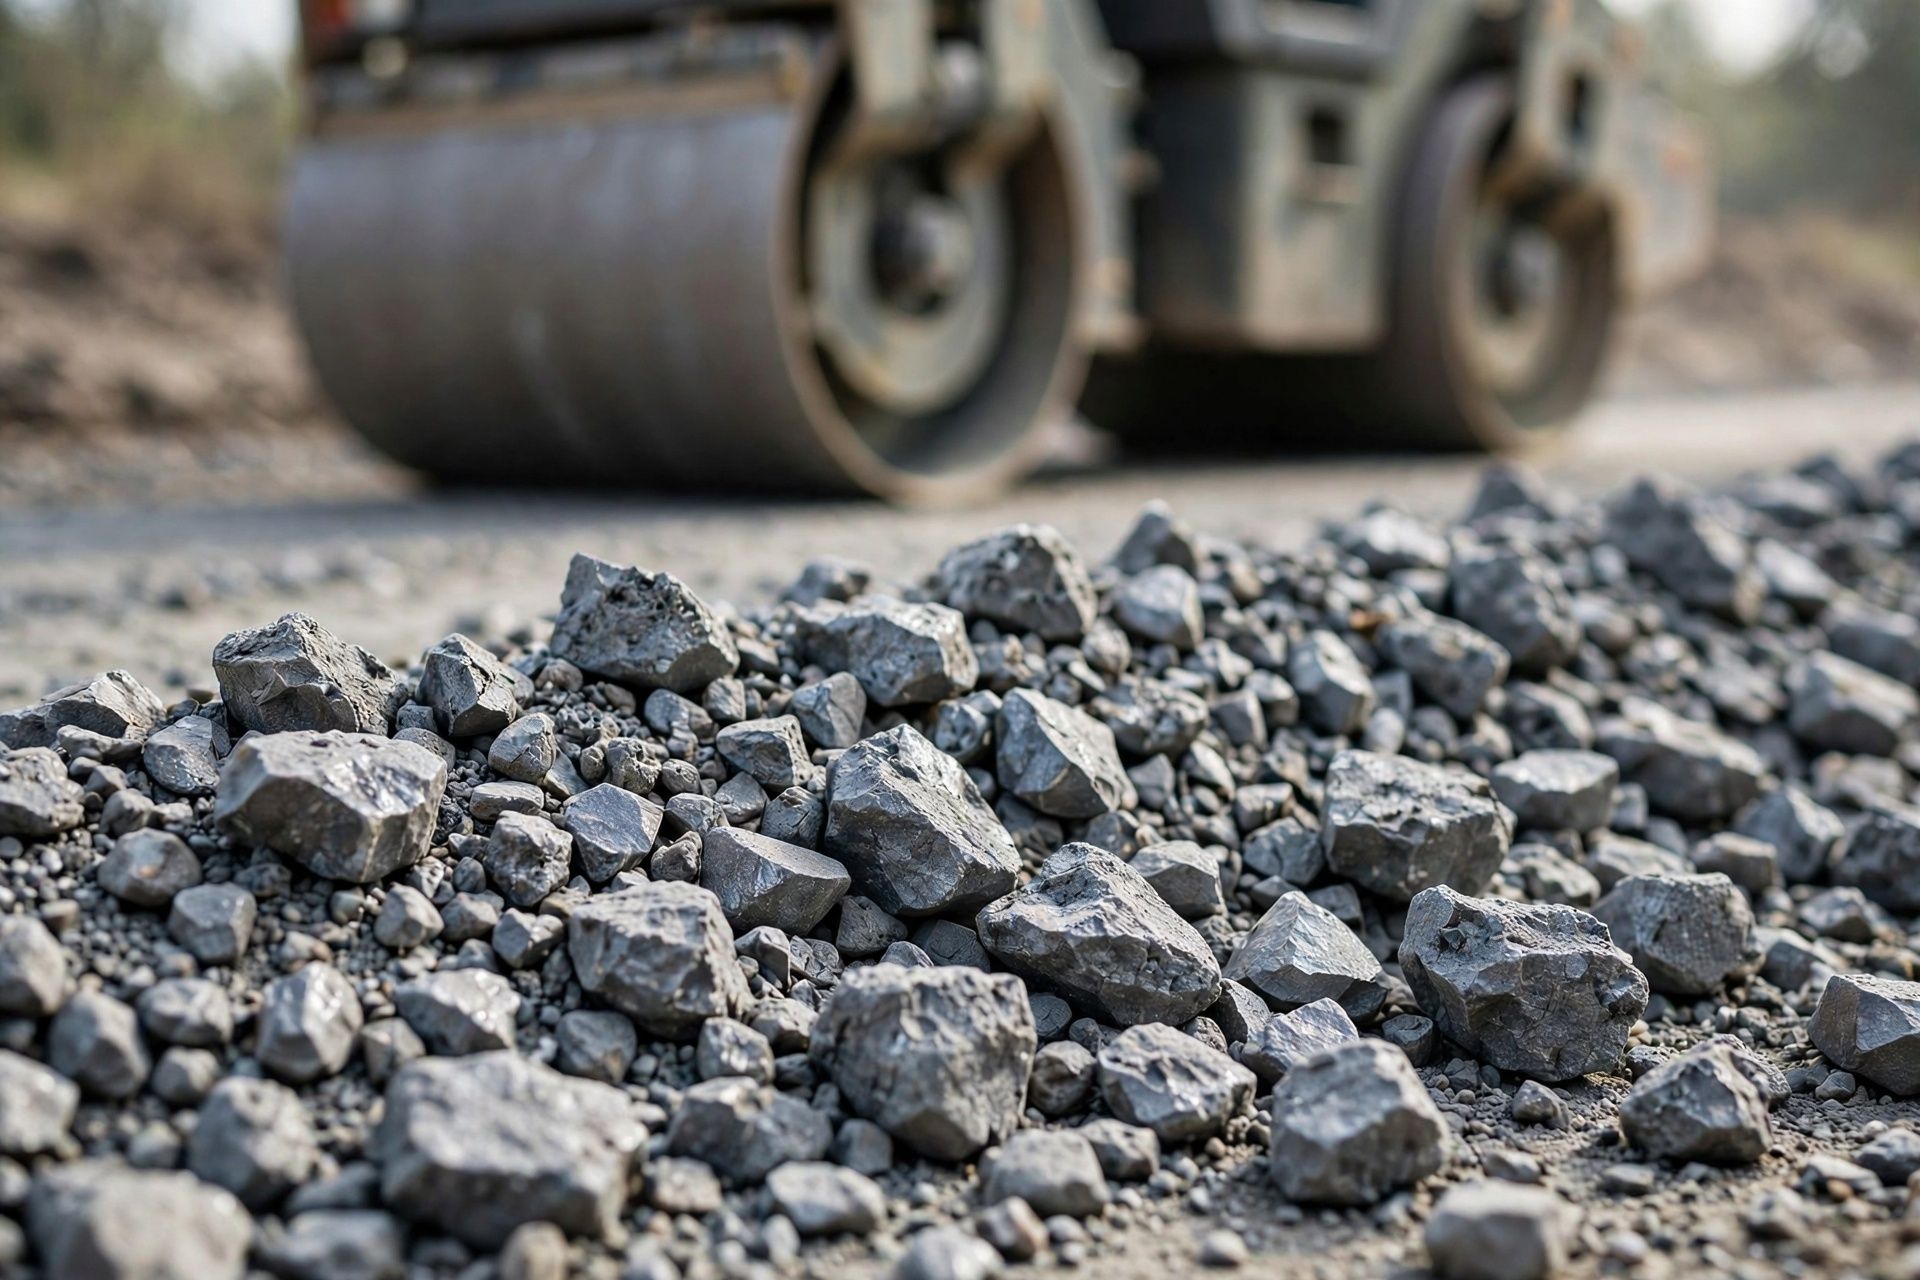
After weathering and leach testing, electric-furnace slag could serve as road aggregate; furnace dust, classed as hazardous, would go to licensed treatment routes.
Surveys will be carried out in all seasons; a landscaped green belt is planned, and the avoid, minimise, offset hierarchy will be applied.
Sourced Sources: Kribi rainfall, 2,836 mm a year on average and 100-year daily rainfall of 264 mm (J.-C. Olivry, Monographie du Nyong et des fleuves côtiers, ORSTOM, 1979); IFC, EHS Guidelines for Integrated Steel Mills (2007).
The framework
The project is subject to a detailed environmental and social impact assessment under framework law No. 96/12 of 5 August 1996 and Decree No. 2013/0171/PM of 14 February 2013, with public hearings. It will rest on a full year of on-site measurements and be aligned with the IFC Performance Standards and the Equator Principles. Above 100,000 t of CO₂ a year, these principles require a climate risk assessment and annual public reporting of emissions: we commit to both.
Sources: Law No. 96/12 of 5 August 1996; Decree No. 2013/0171/PM of 14 February 2013; Equator Principles Association, The Equator Principles EP4 (July 2020).