White paper 06 · Summary
Executive summary: a low-carbon start that only measurement can turn into an asset
An electric-arc steelworks at Mboro, drawing power from Cameroon’s hydro-dominated grid, could make billets, wire rod and reinforcing bar at roughly a third of the world’s average carbon intensity. Our illustrative estimate for the first phase of the reference configuration (RC-1) is about 0.32 tonnes of CO2 per tonne of product within Scopes 1 and 2 (direct emissions on site and purchased electricity) and about 0.58 tonnes once the emissions of imported direct-reduced iron are included, against a 2024 world average of 1.92 tonnes. These are estimates, not measurements. That advantage is real but conditional: it depends on firm low-carbon power, on the carbon content of the iron units the furnace melts, and on measurement good enough to be verified. Carbon border measures, led by the European Union’s mechanism in its definitive phase since 1 January 2026, are turning verified low intensity into a price advantage over ore-based steel, and Central Africa’s iron ore and hydropower give Cameroon a long-term option to make low-carbon iron itself.
In this chapter (4)
ES.1 Twelve findings
- Route choice, not effort at the margin, sets the carbon intensity of steel. Steel accounts for about 7% to 8% of global greenhouse gas emissions [S02]. On worldsteel’s 2024 data, the blast-furnace route emits 2.34 t CO2 per tonne of crude steel, gas-based direct reduction with an electric furnace 1.47 t and scrap-based electric furnaces 0.69 t, for a world average of 1.92 t [S01]. Africa already makes 89% of its crude steel in electric furnaces [S03].
- Cameroon’s grid is about half as carbon-intensive as the world’s. The average intensity of Cameroon’s electricity was about 226 g CO2e/kWh in 2024, against 471 g for the world and 717 g for South Africa [S48]. Hydropower supplied about 72% of generation in 2024 on the Ember dataset and, on the regulator’s dataset, about 90% in 2025 after the 420 MW Nachtigal plant was fully commissioned [S49][S50]; the two datasets differ in coverage. Applying the 2024 fossil emission rate to the 2025 mix suggests an average of about 74 to 96 g/kWh (derived, indicative). 226 g/kWh is therefore conservative against the average, but not against the marginal factor: until the Nachtigal evacuation line and the southern grid are reinforced, new load at Kribi may be served at the margin by gas or oil plants at about 770 g/kWh, which would add up to about 0.5 t per tonne in the hours when thermal plants are on the margin (derived).
- The illustrative footprint of the first phase is about 97,000 t of CO2 a year within Scopes 1 and 2. At its nameplate of 0.3 Mtpa, RC-1 Phase 1 would emit about 31,900 t directly on site (Scope 1) and about 65,300 t through purchased grid electricity, emitted at the power plants (Scope 2). Minor sources outside the model (diesel for mobile plant, LPG and SF6 in switchgear) would add about 3,000 to 7,000 t (assumed). Imported direct-reduced iron or hot-briquetted iron (DRI/HBI) adds about 76,200 t upstream. At the expected sustained output of 270,000 to 300,000 t a year, the annual totals are up to 10% lower and the intensities unchanged. At the 1 Mtpa design capacity the figures are about 328,000 t (Scopes 1+2) and 582,000 t including upstream iron units; intensity stays close to 0.33 and 0.58 t per tonne. With the furnace at the upper planning value of about 490 kWh per tonne for a charge with 30% DRI, rather than 450, each intensity rises by about 0.01 t (derived from the RC-1 reference configuration).
- The iron units the furnace melts matter more than any other single choice. Moving the imported DRI share of the charge from 30% to 50% adds about 0.18 t per tonne; cutting it to 20% saves about 0.09 t. The upstream intensity of that DRI (0.5 to 0.9 t per tonne of DRI) moves the result by about 0.07 t either way, and the grid factor (200 to 300 g/kWh) by −0.03 to +0.07 t. Taken one at a time, these ranges keep the Phase 1 intensity between about 0.49 and 0.75 t per tonne; at their joint extremes it spans about 0.42 to 0.95 t (derived).
- The advantage belongs to the grid as much as to the furnace. The same melt shop on a world-average grid would emit about 0.81 t per tonne including upstream iron units, and about 1.05 t on South Africa’s grid. On this full-footprint basis it would lose its lead over the average scrap-based electric furnace at a grid factor of about 340 g/kWh (derived). Firm, contracted low-carbon power is therefore a carbon decision, not only an energy decision.
- One plant can honestly report seven different numbers. Depending on the perimeter, the same Phase 1 tonne carries about 0.11 t (Scope 1 only), 0.11 t (Scopes 1+2 with a market-based hydro supply contract), 0.20 t (Scopes 1+2 at the 2025 grid cross-check of 96 g/kWh), 0.32 t (Scopes 1+2 at the 2024 grid average), 0.36 t (EU CBAM basis, which for steel counts direct and precursor emissions but not purchased electricity), 0.54 t (per tonne of crude steel on the ISO 14404 and worldsteel basis) or 0.58 t (the same, per tonne of product). Credibility depends on stating the perimeter every time and on third-party verification.
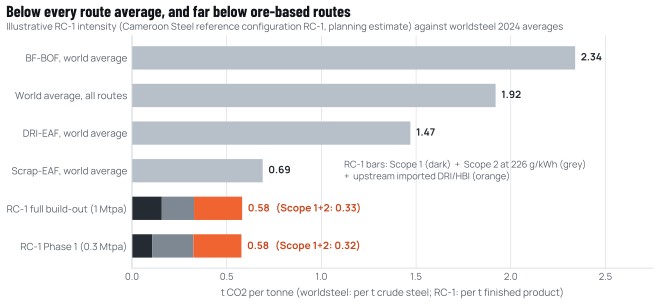
Source: worldsteel Sustainability Indicators 2025 (2024 data) [S01]; Cameroon Steel reference configuration RC-1 (planning estimate), edition 10 October 2026 [S90]; WP06 model (Annex A).
- Carbon border measures reward verified low intensity against ore-based steel, and they price RC-1’s imported iron, not its grid. The EU Carbon Border Adjustment Mechanism (CBAM) covers iron-ore pellets, DRI, billets, reinforcing bar and wire rod [S27]. For steel it counts direct emissions and the direct emissions embedded in precursors such as DRI, but not purchased electricity, so Cameroon’s low-carbon grid earns no CBAM credit [S27]. The certificate price was €82.32/t CO2 for the third quarter of 2026 [S26], and the free allocation that shields EU producers falls from 97.5% of the benchmark in 2026 to zero in 2034 [S28]. For illustration, at a constant 2026 price and with the hot-rolled-coil benchmark used as a proxy for long products, an EU-bound tonne of RC-1 Phase 1 product (0.36 t on the CBAM basis, about 70% of it from the imported DRI) would carry about €24 of CBAM cost in 2026, rising to €30 in 2034; by 2034 gas-based DRI-EAF steel would carry about €82 to €121 and blast-furnace steel about €99 to €193. An all-scrap furnace would pay less than RC-1, about €3 to €9, because scrap carries no precursor emissions. Exporters without verified data face default values with mark-ups of 10% in 2026, 20% in 2027 and 30% from 2028 [S31].
- Green iron is a long-term option for Central Africa, not a near-term product. On Midrex plant statistics, Sub-Saharan Africa produced 0.09 Mt of DRI in 2025 out of a world total of 151 Mt, with the region’s gas-based plants idle [S13]; worldsteel, whose figures include estimates for plants outside that survey, puts output in Uganda, Kenya and Tanzania at about 2.7 Mt [S03]. DR-grade ore is scarce (about 3% of seaborne trade exceeded 66% Fe in IEEFA’s 2022 assessment [S75]), and the direct-shipping ore reported for Mbalam grades a little above 62% Fe [S72], which is blast-furnace grade. A domestic direct-reduction module would need concentration and pelletising, a gas contract and, for hydrogen, electricity on the scale of a large hydro plant: about 0.9 to 1.0 TWh a year for RC-1’s own iron units and 2.4 to 2.8 TWh for a 1 Mt/yr module, against 3.6 TWh delivered by Nachtigal in twelve months (derived) [S52].
- The plant platform is safe from the sea; the port interface and the drainage system are not. The site sits about 40 to 100 m above sea level (rounded; to be confirmed by survey) [S106] and about 3 to 4 km inland (White paper 07, Table D.1). The design issues are extreme rainfall (a 100-year one-day total of 264 mm at Kribi station [S60], which an uplift of about 7% per degree of warming [S59] would take to about 280 to 300 mm), heat and humidity for melt-shop workers, and a coastline that retreated by about 2 m a year on average between 2015 and 2020 [S62].
- Circularity starts with scrap, and Cameroon is short of it. RC-1 Phase 1 needs about 254,000 t of scrap a year at nameplate; the only published estimate of domestic scrap arising is 53,000 to 62,000 t a year (2006 data) [S88], and existing mills already import much of their feed [S89]. RC-1 therefore plans on about 30,000 t a year of domestic scrap (range 0 to 60,000 t, assumed) and imports the balance, which brings Phase 1 port receipts of metallics and consumables to about 351,000 t a year (derived). The works would also produce about 45,000 t of slag, suitable for roads after testing, and about 4,800 t of hazardous furnace dust containing roughly 1,000 to 1,400 t of zinc a year (derived), which European practice recycles almost entirely [S69].
- Lenders will apply their strongest climate rules from the first phase. At 226 g/kWh, Phase 1 process emissions and purchased electricity come to about 97,000 t a year; with diesel, LPG and SF6 the total is about 100,000 to 104,000 t. Phase 1 therefore sits at or about the 100,000 t threshold of the Equator Principles for Scopes 1+2, and later phases are well above it [S22]. Cameroon Steel should therefore plan for a climate change risk assessment, an alternatives analysis and annual public reporting from Phase 1. On ResponsibleSteel’s sliding scale, the illustrative RC-1 intensity clears Progress Level 1 by a wide margin but is far from the IEA’s near-zero threshold [S37][S06].
- Known levers cut the footprint by about 40%; green iron takes it further. Efficiency, lower direct emissions, a grid at about 100 g/kWh, more scrap in the charge (domestic or imported) and certified lower-carbon DRI would bring the 1 Mtpa intensity from about 0.58 to about 0.35 t per tonne; hydrogen-based iron units would take it to about 0.26 t (illustrative). We recommend ten actions, led by a firm low-carbon power contract, a carbon specification for every cargo of iron units, verified reporting from the first heat and an early study of DR-grade concentrate.
ES.2 What this paper is, and what it is not
This is the sixth of ten public white papers in which Cameroon Steel sets out the evidence behind its project at Mboro, in the Kribi industrial-port zone. Its subject is carbon: how much a modern electric-arc long-products works in Cameroon would emit, how that should be measured and reported, what carbon border measures mean for it, how its exposure to a changing climate should be managed, and how the works could move, over two decades, towards very low-carbon steel.
The project figures in this paper come from the Cameroon Steel reference configuration RC-1, a planning estimate prepared for public and regulatory discussion. RC-1 describes a phased works with a design capacity of 1 Mtpa, as reported publicly in January 2025 [S73], starting with an electric-arc melt shop, a ladle furnace and a billet caster (Phase 1, nameplate 0.3 Mtpa, expected sustained output 270,000 to 300,000 t a year), followed by sections mills and additional melting capacity, with a reserve for a future direct-reduction module that could process Cameroonian ore. Works are targeted to start in the first quarter of 2029, with a first heat in the second half of 2030 and ramp-up through 2031. Phase 1’s melt shop makes billets, and its output can move between rolled products (wire rod and reinforcing bar) and merchant billets for existing re-rollers, which today import much of their charge [S89]. Its tonnage is aimed at replacing imported billets and wire rod and at CEMAC exports, not at the domestic reinforcing-bar market, where capacity already exceeds demand (White paper 04). The footprint is computed for fully rolled output by multiplying RC-1 volumes by published or assumed consumption benchmarks and emission factors, each with a range; a tonne sold as billet carries less (Chapter 4). It is an estimate made before front-end engineering, not a measurement or a guarantee.
ES.3 How the paper is organised
Table ES.1 The questions each chapter answers
| Chapter | Question | Main exhibits |
|---|---|---|
| 1 Steel and climate | Why does the route matter more than anything else? | Route intensities; route shares; IEA anatomy of emissions |
| 2 Accounting carbon in steel | What should be counted, and by which standard? | Framework matrix; one plant, seven numbers |
| 3 The grid factor | How much of the advantage comes from Cameroon’s power system? | Generation mix; grid intensities; sensitivity line |
| 4 An illustrative footprint | What would RC-1 emit, phase by phase, and what moves the result? | Footprint by phase; waterfall; tornado; heat map |
| 5 Carbon border measures | What would EU and UK border charges mean in practice? | Phase-in; gross and net exposure |
| 6 Green iron | Can Central Africa make low-carbon iron, and on what conditions? | DRI output; route ladder; hydrogen power need; stepwise route |
| 7 Climate risk and adaptation | What does a changing climate mean for a coastal steelworks? | Rainfall; extremes; sea level and shoreline |
| 8 Circularity | What happens to scrap, slag and dust? | Residues; scrap need; scrap share |
| 9 Finance and standards | What will lenders, buyers and certifiers ask for? | Lender thresholds; sliding scales |
| 10 Pathway and recommendations | What should be done, by whom and when? | Pathway waterfall; trajectory; ten recommendations |
| 11 Evidence gaps | What is not yet known, and how will it be resolved? | Gap register |
Source: Cameroon Steel, this paper.
ES.4 What Cameroon Steel intends to do with these findings
The findings point to a short list of decisions that fix the carbon performance of the works for decades, and that are best taken before the equipment is ordered. The first is power: an electric-arc works is only as clean as the electricity it draws, so a firm supply contract backed by identified low-carbon generation, and a connection that keeps the furnace on hydro power through the dry season, is the single most valuable carbon decision after the choice of route. The second is iron units: every cargo of DRI or HBI should come with verified carbon data and a contractual intensity ceiling, since under CBAM the DRI, not the electricity, sets most of the charge on an EU-bound tonne; and the share of scrap in the charge should rise as domestic collection and import contracts allow. The third is measurement: the works should be instrumented and its inventory designed from the outset to report on the GHG Protocol, ISO 14404 and EU CBAM bases, verified by an accredited third party, so that buyers can use actual rather than default values. The fourth is optionality: the land, utilities and permits for a future direct-reduction module should be preserved, while the critical unknown, whether Cameroonian ore can be upgraded economically to DR-grade pellets, is studied early.
None of this makes Cameroonian steel "green" today. What it does is place a new works on the right side of the carbon divide from its first heat, with a credible and measurable route to go further as power, iron units and finance allow. Chapter 10 sets out the recommendations in detail, and Chapter 11 lists the evidence gaps that must close before any of the illustrative figures in this paper can become measured ones. Companion papers treat the power system (White paper 05), the route choice (White paper 03) and the market for Phase 1 output, including the cost of a Kribi billet against an imported one (White paper 04, Chapter 8).
Statement of interest. This paper is published by Cameroon Steel, which is developing a steelworks at Kribi. It is written to inform public debate; its analysis is independent of any commercial offer, and every figure is sourced or labelled with its status.
Sources cited in this chapter
Bracketed markers refer to these sources; the full list is in the annex. Full list of sources
- S02Climate change and the production of iron and steel (policy paper). worldsteel.worldsteel.org/climate-action/climate-change-and-the-production-of-iro…
- S01Sustainability Indicators 2025 report (2024 data; route table added February 2026). worldsteel, Nov 2025; upd. Feb 2026.worldsteel.org/wider-sustainability/sustainability-indicators/
- S03World Steel in Figures 2026. worldsteel, 4 Jun 2026.worldsteel.org/data/world-steel-in-figures/world-steel-in-figures-2026…
- S48Carbon intensity of electricity generation (Ember data). Our World in Data, dataset accessed 10 Oct 2026.ourworldindata.org/grapher/carbon-intensity-electricity
- S49Electricity production by source (Ember and Energy Institute data). Our World in Data, dataset accessed 10 Oct 2026.ourworldindata.org/grapher/electricity-prod-source-stacked
- S50Rapport d’activités 2025 de l’ARSEL. ARSEL (electricity regulator, Cameroon), 7 Sep 2026.arsel-cm.org/wp-content/uploads/2026/09/Rapport-ARSEL-2025.pdf
- S90Cameroon Steel reference configuration RC-1 (planning estimate): phases, planning values, balances and indicative schedule, edition 10 October 2026. Cameroon Steel, 10 Oct 2026.Cited by title and date
- S27Regulation (EU) 2023/956 establishing a carbon border adjustment mechanism, Annexes I and II. Official Journal of the EU, L 130, 16 May 2023.eur-lex.europa.eu/legal-content/EN/TXT/PDF/?uri=CELEX:32023R0956
- S26Price of CBAM certificates. European Commission, DG TAXUD, latest 5 Oct 2026.taxation-customs.ec.europa.eu/carbon-border-adjustment-mechanism/price…
- S28Directive (EU) 2023/959 amending the EU Emissions Trading System Directive. Official Journal of the EU, L 130, 16 May 2023.eur-lex.europa.eu/legal-content/EN/TXT/?uri=CELEX:32023L0959
- S31EU Commission finalizes CBAM benchmarks, default values ahead of January 2026 launch. EUROMETAL, Dec 2025.eurometal.net/eu-commission-finalizes-cbam-benchmarks-default-values-a…
- S132025 World Direct Reduction Statistics. Midrex Technologies, Sep 2026.midrex.com/world-dri-statistics/world-dri-production-reaches-151-0-mt-…
- S75Iron Ore Quality a Potential Headwind to Green Steelmaking. Institute for Energy Economics and Financial Analysis (IEEFA), Jun 2022.ieefa.org/sites/default/files/2022-06/Iron%20Ore%20Quality%20a%20Poten…
- S72Kribi: le Premier ministre, chef du gouvernement est là (foundation stone of the Kribi steel complex). Cameroon Tribune, 30 Dec 2024.cameroon-tribune.cm/article.html/68499/fr.html/details_2
- S52Énergie: Nachtigal franchit le cap des 3,6 TWh injectés dans le réseau en un an. Journal du Cameroun, 15 Jun 2026.fr.journalducameroun.com/energie-nachtigal-franchit-le-cap-des-36-twh-…
- S106SRTM 30 m digital surface model, accessed through the OpenTopoData API. NASA; OpenTopoData.opentopodata.org/datasets/srtm/
- S60Monographie du Nyong et des fleuves côtiers, Tome 1 (J.-C. Olivry). ORSTOM, Jul 1979.horizon.documentation.ird.fr/exl-doc/pleins_textes/divers11-03/01948.p…
- S59Climate Change 2021: The Physical Science Basis, Summary for Policymakers. IPCC Working Group I, 2021.ipcc.ch/report/ar6/wg1/downloads/report/IPCC_AR6_WGI_SPM.pdf
- S62Weakening of coastlines and coastal erosion in the Gulf of Guinea: the case of the Kribi coast (Fendoung, Tchindjang and Hubert-Ferrari), Land 11:1557. MDPI, 2022.doi.org/10.3390/land11091557
- S88La récupération et le recyclage des déchets ferromagnétiques: analyse de la situation au Cameroun (Bidoung, Fomethe, Yantio, Melo), Déchets: revue francophone d’écologie industrielle no. 48. ENSP Yaoundé / MIPROMALO (Episciences), Q4 2007.eid.episciences.org/7942/pdf
- S89Cameroun: le groupe Prometal décroche 26 milliards FCFA auprès d’Afreximbank. Sikafinance, 30 Sep 2026.sikafinance.com/marches/cameroun-le-groupe-prometal-decroche-26-millia…
- S69Recycling of electric arc furnace dust (zinc recovery, Waelz process). Galvanizers Association, n.d., accessed 10 Oct 2026.galvanizing.org.uk/?p=32698
- S22The Equator Principles EP4. Equator Principles Association, Jul 2020 (effective 1 Oct 2020).equator-principles.com/app/uploads/The-Equator-Principles_EP4_July2020…
- S37The Decarbonisation Progress Levels. ResponsibleSteel, 23 Sep 2024.responsiblesteel.org/resources/the-decarbonisation-progress-levels
- S06Achieving Net Zero Heavy Industry Sectors in G7 Members. International Energy Agency, 19 May 2022.iea.blob.core.windows.net/assets/c4d96342-f626-4aea-8dac-df1d1e567135/…
- S73Industrialisation: la voie royale de l’émergence. Cameroon Tribune, 2 Jan 2025.cameroon-tribune.cm/article.html/68558/fr.html/details_2
Cite this chapter
Cameroon Steel (2026). Lower-carbon steel from Cameroon: it could reach a third of the world’s carbon intensity. White paper 06, Executive summary: a low-carbon start that only measurement can turn into an asset. CS-WP-06. https://www.cameroon-steel.com/en/library/lower-carbon-steel/executive-summary/
Source