White paper 06 · Chapter 4
An illustrative footprint: about 0.3 t within Scopes 1 and 2, about 0.6 t with imported iron
On the RC-1 planning basis, the first phase of the Mboro works would emit about 97,000 t of CO2 a year within Scopes 1 and 2 at nameplate output, from direct emissions on site and purchased electricity, or about 0.32 t per tonne of rolled product; minor fuels and SF6 would add a few thousand tonnes. Imported DRI or HBI would add about 76,000 t upstream, taking the total to about 0.58 t per tonne. At the 1 Mtpa design capacity the annual totals roughly triple while the intensity barely moves. The single largest uncertainty is not the grid but the iron units: their share of the charge and how they were made.
In this chapter (8)
- 4.1 The reference configuration
- 4.2 The method: volumes times benchmarks, with every range stated
- 4.3 The footprint by phase
- 4.4 Inside a Phase 1 tonne
- 4.5 What moves the result: iron units first, then the grid
- 4.6 How RC-1 compares with route averages
- 4.7 What the footprint excludes, and why it matters
- 4.8 From estimate to measurement
4.1 The reference configuration
The Cameroon Steel reference configuration RC-1 is the planning estimate that Cameroon Steel uses for public and regulatory discussion of the project. It is not a frozen design. It describes an electric-arc long-products works in three phases, with a reserve for a direct-reduction module, as summarised in Table 4.1. The project’s design capacity of 1 Mtpa, and the focus of its first phase on long products for construction, are on the public record [S73][S72].
Phase 1’s melt shop makes billets. Its output can move between rolled products (wire rod and reinforcing bar) and merchant billets sold to Cameroon’s existing re-rollers, which report that local scrap covers only about 40% of their needs and that the balance comes from imported billets [S89]. The tonnage is aimed at replacing imported billets and wire rod and at exports to the CEMAC region; the domestic reinforcing-bar market already has more rolling capacity than demand, so new rebar capacity alone would not close a gap (White paper 04). Phase 1 has a nameplate of 300,000 t a year; with a single furnace, the expected sustained output is 270,000 to 300,000 t, depending on utilisation. The footprint below is computed at nameplate for fully rolled output; the footprint section below also shows what a tonne sold as billet would carry.
Table 4.1 The RC-1 reference configuration (indicative)
| Phase | Main units | Finished output | Reheating before rolling | Timing (indicative) | Status |
|---|---|---|---|---|---|
| Phase 1 | Electric-arc furnace of the 40 t class, ladle furnace, billet caster, induction billet heating, reinforcing-bar mill, high-speed wire-rod mill | 300,000 t/yr nameplate (270,000 to 300,000 t expected sustained); billets for rolling or merchant sale | Electric induction, partly hot-charged | Works from Q1 2029; first heat H2 2030; ramp-up 2031 | planned |
| Phase 2 | Second melt line (EAF, LF, caster), light and medium sections mill | +200,000 t/yr | Natural-gas walking-beam furnace | 2032 to 2034, subject to market and financing | indicative |
| Phase 3 | Melt-shop expansion, heavy sections and H-beam mill | +500,000 t/yr, to 1,000,000 t/yr | Natural-gas walking-beam furnace | After 2034, subject to market and financing | indicative |
| Reserve | Direct-reduction module for Cameroonian ore | Not in the footprint | Not applicable | Later, subject to ore quality, gas supply and approvals | indicative |
Source: Cameroon Steel reference configuration RC-1 (planning estimate), edition 10 October 2026 [S90].
The metallic charge in every phase is assumed to be about 70% scrap and 30% imported DRI or HBI, the planning value in the RC-1 reference configuration, with a range of 20% to 50% DRI. Scrap would be bought domestically as far as collection allows, about 30,000 t a year in the planning case (range 0 to 60,000 t), and imported for the balance (Chapter 8). Figure 4.1 shows the process chain and where emissions enter it.
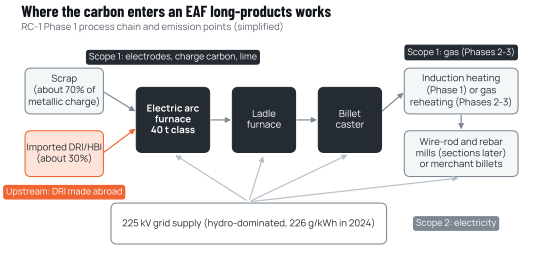
Source: Cameroon Steel reference configuration RC-1 (planning estimate) [S90]. Simplified diagram.
4.2 The method: volumes times benchmarks, with every range stated
The footprint is a gate-to-gate inventory extended upstream to the imported iron units. It follows the boundary logic of the GHG Protocol and ISO 14404 described in Chapter 2 and uses four relationships, set out in full in Annex A:
- Liquid steel equals finished product divided by the cast-and-roll yield (0.94); metallic charge equals liquid steel divided by the metallic yield (0.88).
- Scope 1 equals liquid steel times a direct factor of 0.10 t CO2 per tonne (electrodes, charge and injection carbon, the carbonate share of fluxes), plus natural gas burnt for reheating times 0.0561 t CO2 per GJ, the IPCC default for natural gas [S57].
- Scope 2 equals electricity times the grid factor (226 g/kWh), where electricity is liquid steel times 520 kWh/t (450 for the furnace, the planning value within the IFC range of 347 to 500 [S20], plus 70 for auxiliaries; about 490 is the upper planning value for a 30% DRI charge), plus finished product times 110 kWh/t for rolling (IFC range 70 to 140 [S20]), plus, in Phase 1, 300 kWh/t for induction heating.
- Upstream DRI/HBI equals metallic charge times the DRI share (30%) times 0.70 t CO2 per tonne of DRI, a planning value for gas-based shaft-furnace iron with a range of 0.5 to 0.9.
Table 4.2 gives the resulting activity data. All values are at nameplate output for a full year; ramp-up years would be lower in absolute terms and, typically, higher in intensity.
Table 4.2 Activity data by phase (RC-1 balances at nameplate output)
| Quantity | Unit | Phase 1 | Phases 1+2 | Full build-out | Status |
|---|---|---|---|---|---|
| Finished product | t/yr | 300,000 | 500,000 | 1,000,000 | planned |
| Liquid (crude) steel | t/yr | 319,149 | 531,915 | 1,063,830 | derived |
| Metallic charge | t/yr | 362,669 | 604,449 | 1,208,897 | derived |
| of which imported DRI/HBI | t/yr | 108,801 | 181,335 | 362,669 | derived |
| of which scrap | t/yr | 253,868 | 423,114 | 846,228 | derived |
| Electricity | MWh/yr | 288,957 | 421,596 | 753,191 | derived |
| Average electrical load (8,000 h) | MW | 36.1 | 52.7 | 94.1 | derived |
| Natural gas for reheating | GJ/yr | 0 | 260,000 | 910,000 | derived |
Source: Cameroon Steel reference configuration RC-1 (planning estimate), balances for Phase 1, Phases 1+2 and full build-out [S90].
4.3 The footprint by phase
Table 4.3 and Figure 4.2 give the resulting annual footprint. Scopes 1 and 2 rise from about 97,000 t in Phase 1 to about 163,000 t with Phase 2 and about 328,000 t at 1 Mtpa. Upstream iron units add 76,000 to 254,000 t. Because every phase uses the same charge mix and similar benchmarks, the intensity stays almost constant at about 0.32 to 0.33 t per tonne for Scopes 1 and 2 and 0.58 t including upstream.
Table 4.3 Annual footprint by phase at nameplate output (t CO2 per year)
| Component | Phase 1 (0.3 Mtpa) | Phases 1+2 (0.5 Mtpa) | Full build-out (1 Mtpa) | Status |
|---|---|---|---|---|
| Scope 1, furnace and ladle (electrodes, carbon, lime) | 31,915 | 53,191 | 106,383 | derived |
| Scope 1, natural-gas reheating | 0 | 14,586 | 51,051 | derived |
| Scope 1 total | 31,915 | 67,777 | 157,434 | derived |
| Scope 2, grid electricity at 226 g/kWh | 65,304 | 95,281 | 170,221 | derived |
| Scopes 1+2 | 97,219 | 163,058 | 327,655 | derived |
| Upstream imported DRI/HBI | 76,161 | 126,934 | 253,868 | derived |
| Total including upstream DRI | 173,380 | 289,992 | 581,524 | derived |
| Scopes 1+2 per t product | 0.324 | 0.326 | 0.328 | derived |
| Total per t product | 0.578 | 0.580 | 0.582 | derived |
Source: WP06 model on the Cameroon Steel reference configuration RC-1 (planning estimate) [S90]; values agree with the RC-1 balances to the tonne.
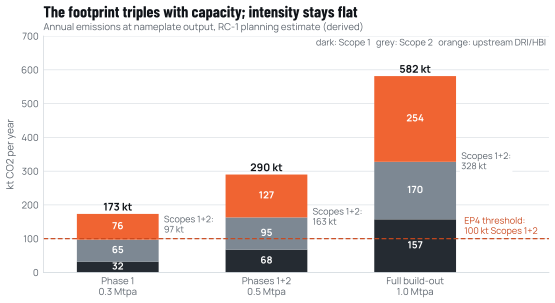
Source: WP06 model on the Cameroon Steel reference configuration RC-1 (planning estimate) [S90]; Equator Principles EP4 [S22].
The composition shifts as the works grows. In Phase 1, with induction heating, grid electricity is about two-thirds of Scopes 1 and 2. In Phases 2 and 3, gas-fired reheating moves part of the energy use from Scope 2 to Scope 1, so that at 1 Mtpa the two scopes are of similar size. The choice between induction and gas reheating is therefore partly a carbon choice: on Cameroon’s grid at 226 g/kWh, 300 kWh of induction heating emits about 0.068 t per tonne, while 1.3 GJ of gas emits about 0.073 t, so the two are close; on a cleaner grid, induction wins clearly.
A tonne sold as merchant billet leaves the works before reheating and rolling. Per tonne of cast steel, a Phase 1 billet would carry about 0.10 t of direct emissions and about 0.12 t from melt-shop electricity, or about 0.22 t within Scopes 1 and 2, and about 0.46 t including the upstream DRI; on the CBAM basis it would carry about 0.34 t (derived). Selling billets rather than rolled products therefore lowers the works’ own Scopes 1 and 2, but the reheating and rolling emissions move to the buyer’s mill rather than disappear.
4.4 Inside a Phase 1 tonne
Figure 4.3 breaks a tonne of Phase 1 product into its components. Melt-shop electricity (furnace, ladle furnace and auxiliaries) is the largest item within Scopes 1 and 2 at about 0.125 t, followed by the furnace’s direct emissions at about 0.106 t, induction heating at about 0.068 t and rolling electricity at about 0.025 t. The upstream emissions of the DRI in the charge, at about 0.254 t, exceed any single item within Scopes 1 and 2.
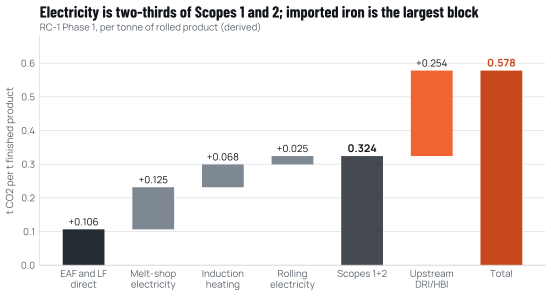
Source: WP06 model on the Cameroon Steel reference configuration RC-1 (planning estimate) [S90] (Annex A).
Table 4.4 Electricity use and Scope 2 emissions by consumer
| Consumer | Basis | Phase 1, MWh/yr | Phase 1, t CO2 | Full build-out, MWh/yr | Full build-out, t CO2 |
|---|---|---|---|---|---|
| Electric-arc furnace, ladle furnace, auxiliaries | 520 kWh/t liquid | 165,957 | 37,506 | 553,191 | 125,021 |
| Rolling mills | 110 kWh/t product | 33,000 | 7,458 | 110,000 | 24,860 |
| Induction billet heating | 300 kWh/t, Phase 1 only | 90,000 | 20,340 | 90,000 | 20,340 |
| Total | 288,957 | 65,304 | 753,191 | 170,221 |
Source: WP06 model on the Cameroon Steel reference configuration RC-1 (planning estimate) [S90]; benchmarks from IFC [S20] and the RC-1 reference configuration.
Three practical conclusions follow for the design. First, furnace efficiency matters more than any other electricity measure, because the melt shop takes 57% of Phase 1 electricity and 73% at full build-out; scrap preparation, foamy-slag practice, oxy-fuel assistance, hot-heel operation and continuous scrap charging (which reported 321 kWh/t at one Asian plant [S94]) are all relevant. Second, hot charging of billets straight from the caster reduces the induction load, and the 300 kWh/t planning value already assumes partial hot charging. Third, the direct factor of 0.10 t per tonne is a planning value that should be replaced by measured carbon and electrode balances from the first campaigns.
4.5 What moves the result: iron units first, then the grid
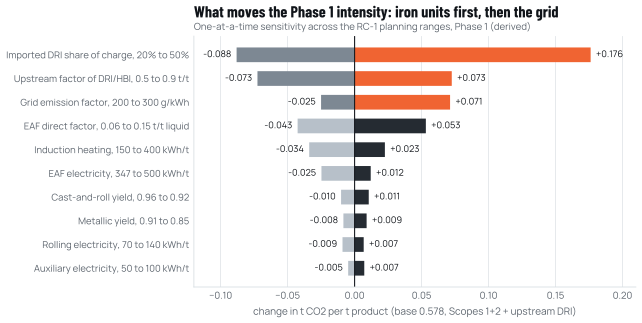
Figure 4.4 tests the Phase 1 intensity, including upstream iron units, against the range of every parameter in the RC-1 reference configuration, one at a time. The ranges come from published benchmarks where they exist (IFC for furnace and rolling electricity [S20]) and from planning assumptions where they do not.
Source: WP06 model on the Cameroon Steel reference configuration RC-1 (planning estimate) [S90]; DRI power penalty of about 14.5 kWh/t per 10 points of DRI in the charge from the EC Innovation Centre for Industrial Transformation [S15].
Table 4.5 Sensitivity of the Phase 1 intensity to the three decisive parameters and to the upper furnace planning value (t CO2 per tonne of product)
| Parameter | Range tested | Change in Scopes 1+2 | Change in total incl. upstream | Resulting total |
|---|---|---|---|---|
| Imported DRI share of charge | 20% to 50% | −0.004 to +0.007 | −0.088 to +0.176 | 0.49 to 0.75 |
| Upstream intensity of DRI/HBI | 0.5 to 0.9 t/t DRI | none | −0.073 to +0.073 | 0.51 to 0.65 |
| Grid emission factor | 200 to 300 g/kWh | −0.025 to +0.071 | −0.025 to +0.071 | 0.55 to 0.65 |
| Furnace electricity at the upper planning value (490 instead of 450 kWh/t) | 490 kWh/t | +0.010 | +0.010 | 0.59 |
| All three decisive parameters at their joint extremes | −0.028 to +0.081 | −0.161 to +0.371 | 0.42 to 0.95 |
Source: WP06 model on the Cameroon Steel reference configuration RC-1 (planning estimate) [S90]. Base: Scopes 1+2 0.324; total 0.578. The DRI share changes Scopes 1+2 slightly because DRI needs more furnace electricity than scrap.
The DRI share dominates because it acts on the largest block. Each 10 points of DRI added to the charge, in place of scrap, adds about 0.09 t per tonne at 0.7 t per tonne of DRI. The upstream intensity of the DRI is the next lever: buying DRI made at 0.5 rather than 0.9 t per tonne is worth about 0.15 t per tonne of steel at a 30% share. The grid factor follows, with an asymmetric range because the planning value of 226 g/kWh sits near the lower end of the band. The furnace’s direct factor (0.06 to 0.15 t per tonne of liquid steel) is the largest uncertainty in direct emissions on site, and the only one of these parameters that is mostly in the operator’s hands. The furnace’s electricity matters less: moving from the planning value of 450 kWh/t to the upper planning value of about 490 kWh/t for a 30% DRI charge adds about 0.01 t per tonne.
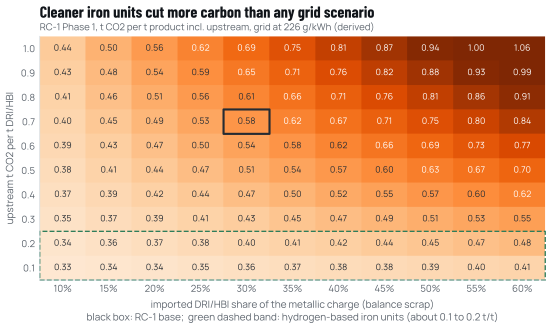
Figure 4.5 shows how the first two levers interact. The RC-1 base case sits in the middle of the map. Halving the DRI share at the same upstream intensity has about the same effect as halving the upstream intensity at the same share; doing both, or replacing gas-based DRI with hydrogen-based iron units at about 0.1 to 0.2 t per tonne, takes the total to about 0.4 t per tonne or below even at today’s grid factor.
Source: WP06 model on the Cameroon Steel reference configuration RC-1 (planning estimate) [S90]; DRI power penalty from [S15]; hydrogen-based iron range discussed in Chapter 6.
4.6 How RC-1 compares with route averages
On the ISO 14404 and worldsteel basis, per tonne of crude steel, the illustrative RC-1 intensity including upstream iron units is about 0.54 t in Phase 1 and 0.55 t at full build-out. That is about 21% below the world average for scrap-based electric furnaces (0.69 t), about 63% below gas-based DRI-EAF (1.47 t), about 72% below the world average for all routes (1.92 t) and about 77% below the blast-furnace route (2.34 t) [S01]. On a per-tonne-of-product basis, which is how this paper reports RC-1 and which slightly overstates it, the total of about 0.58 t is about 30% of the world average.
These comparisons need three cautions. RC-1 is an estimate, not a measurement; route averages describe real plants. RC-1’s boundary does not yet count every purchased input that worldsteel includes (ferroalloys, lime, electrodes made elsewhere), which would add a few hundredths of a tonne; Cameroon Steel’s monitoring plan would close that gap from the first year of operation. And the comparison with the scrap-EAF average flatters no one: RC-1 melts a lower share of scrap than a typical scrap-based plant, but runs on a cleaner grid, and the two effects roughly offset.
4.7 What the footprint excludes, and why it matters
Five categories are outside the estimate. They are listed so that the direction of any bias is clear.
- Other purchased inputs. Ferroalloys, lime, electrodes and refractories made elsewhere, and any oxygen or industrial gases bought in rather than made on site with grid electricity. These would raise a cradle-to-gate product footprint by an amount to be measured.
- Transport. Sea freight of imported scrap and DRI to Kribi, and transport of finished products. These belong in Scope 3 and will be reported.
- Construction and land-use change. The embodied emissions of buildings and equipment, and any carbon released by clearing vegetation on the site, will be quantified in the environmental and social impact assessment once the vegetation survey and construction plan are available.
- Methane and nitrous oxide. These are minor for the electric route: worldsteel’s CO2e intensity for scrap-EAF is only 0.02 t above its CO2 intensity [S01].
- Minor fuels and SF6. Diesel for mobile plant and standby generators, liquefied petroleum gas (LPG) for ladle and tundish preheating, and leakage of sulphur hexafluoride (SF6) from high-voltage switchgear are direct emissions that the RC-1 balances do not model. We estimate them at 0.01 to 0.02 t CO2 per tonne of liquid steel for the fuels, and at 0.5% a year of a 0.5 to 2 t SF6 inventory at a global warming potential of 23,500 [S105]: about 3,000 to 7,000 t CO2e a year in Phase 1 (assumed). They are small per tonne, about 0.01 to 0.02 t, but they take Phase 1 Scopes 1 and 2 to about 100,000 to 104,000 t, which matters for the lender threshold (Chapter 9).
The estimate also assumes nameplate operation. At the expected sustained output of 270,000 to 300,000 t, Phase 1’s annual emissions would be up to 10% lower at the same intensity. During ramp-up, furnaces run below their best energy performance and yields are lower, so intensity is typically higher in the first year or two. Cameroon Steel would report actual figures from the first heat, so that the trajectory is visible.
4.8 From estimate to measurement
The numbers in this chapter are only as good as the benchmarks behind them. The next step, at front-end engineering, is to replace the planning values with the technology supplier’s guaranteed consumptions, the power utility’s contracted supply and the carbon data of named suppliers of DRI and HBI. After commissioning, measured data take over. Chapter 10 sets out the monitoring, reporting and verification plan that makes that transition auditable; Chapter 5 shows why it is worth money.
Sources cited in this chapter
Bracketed markers refer to these sources; the full list is in the annex. Full list of sources
- S73Industrialisation: la voie royale de l’émergence. Cameroon Tribune, 2 Jan 2025.cameroon-tribune.cm/article.html/68558/fr.html/details_2
- S72Kribi: le Premier ministre, chef du gouvernement est là (foundation stone of the Kribi steel complex). Cameroon Tribune, 30 Dec 2024.cameroon-tribune.cm/article.html/68499/fr.html/details_2
- S89Cameroun: le groupe Prometal décroche 26 milliards FCFA auprès d’Afreximbank. Sikafinance, 30 Sep 2026.sikafinance.com/marches/cameroun-le-groupe-prometal-decroche-26-millia…
- S90Cameroon Steel reference configuration RC-1 (planning estimate): phases, planning values, balances and indicative schedule, edition 10 October 2026. Cameroon Steel, 10 Oct 2026.Cited by title and date
- S572006 IPCC Guidelines for National Greenhouse Gas Inventories, Volume 2: Energy. IPCC, 2006.ipcc-nggip.iges.or.jp/public/2006gl/vol2.html
- S20Environmental, Health, and Safety Guidelines for Integrated Steel Mills. IFC / World Bank Group, 30 Apr 2007.ifc.org/content/dam/ifc/doc/2000/2007-integrated-steel-mills-ehs-guide…
- S22The Equator Principles EP4. Equator Principles Association, Jul 2020 (effective 1 Oct 2020).equator-principles.com/app/uploads/The-Equator-Principles_EP4_July2020…
- S94Enhanced EAF steelmaking through continuous charging, scrap preheating (Consteel). European Commission, Innovation Centre for Industrial Transformation, n.d., accessed 10 Oct 2026.innovation-centre-for-industrial-transformation.ec.europa.eu/innovativ…
- S15ENERGIRON technology: DRI-EAF production route using natural gas or H2. European Commission, Innovation Centre for Industrial Transformation, ref. 12 Feb 2026.innovation-centre-for-industrial-transformation.ec.europa.eu/innovativ…
- S01Sustainability Indicators 2025 report (2024 data; route table added February 2026). worldsteel, Nov 2025; upd. Feb 2026.worldsteel.org/wider-sustainability/sustainability-indicators/
- S105Climate Change 2013: The Physical Science Basis, Chapter 8, Anthropogenic and natural radiative forcing (global warming potentials; SF6 = 23,500). IPCC Working Group I, 2013.ipcc.ch/report/ar5/wg1/
Cite this chapter
Cameroon Steel (2026). Lower-carbon steel from Cameroon: it could reach a third of the world’s carbon intensity. White paper 06, chapter 4: An illustrative footprint: about 0.3 t within Scopes 1 and 2, about 0.6 t with imported iron. CS-WP-06. https://www.cameroon-steel.com/en/library/lower-carbon-steel/illustrative-footprint/
Source