White paper 06 · Chapter 1
Steel and climate: the route decides
Steel is one of the largest single sources of industrial carbon dioxide, and the production route decides most of a tonne’s footprint before any operator makes a choice on the shop floor. On worldsteel’s 2024 data, a tonne made in a blast furnace emits more than three times as much CO2 as a tonne melted from scrap in an electric-arc furnace. A new works that chooses the electric route, and connects it to a low-carbon grid, starts on the right side of that divide.
In this chapter (6)
- 1.1 Steel accounts for about 7% to 8% of global greenhouse gas emissions
- 1.2 Three routes, three carbon profiles
- 1.3 Where the carbon comes from inside each route
- 1.4 The world is shifting towards electric steel, and Africa is already there
- 1.5 Scrap is the cleanest input, and it is finite
- 1.6 What this means for a new works in Cameroon
1.1 Steel accounts for about 7% to 8% of global greenhouse gas emissions
The world made 1,849.4 Mt of crude steel in 2025, 2.0% less than the 1,886.8 Mt of 2024, in a third consecutive year of slightly falling output led by China [S04]. worldsteel estimates that the industry’s average greenhouse gas intensity was 2.18 t of CO2-equivalent per tonne in 2024 and that the sector accounts for about 7% to 8% of global anthropogenic greenhouse gas emissions [S01][S02]. Multiplying the 2024 output by that average gives roughly 4.1 Gt of CO2e a year (derived). Earlier work by the Energy Transitions Commission, using a narrower energy-system boundary, put the sector at about 2.3 Gt of CO2 a year and about 7% of energy-system emissions [S09]. The two figures differ because of what they count, a theme that runs through this paper, but they agree on the order of magnitude: steel is too large to leave out of any serious climate strategy.
Steel’s emissions are also unusually hard to abate. In the dominant blast-furnace route, carbon is not only a fuel but the chemical agent that strips oxygen from iron ore. Coke, made from metallurgical coal, reduces the ore inside the furnace and leaves as carbon monoxide and dioxide. That chemistry cannot be electrified away by switching a burner; it requires a different reducing agent (natural gas, hydrogen), a different route (melting scrap rather than reducing ore) or capture of the CO2 after it forms. The International Energy Agency’s technology roadmap describes the sector as one of the hardest to decarbonise for exactly this reason [S05].
At the same time, demand for steel will keep growing where infrastructure is still being built. Africa used 45.0 Mt of finished steel in 2025, up 10.4% in a year, and worldsteel expects a further 3.8% in 2026 and 4.6% in 2027 [S92]. Yet Africa uses about 29 kg of steel per person against a world average of 209 kg [S03]. Meeting that demand from the most carbon-intensive routes would add materially to global emissions; meeting it from low-carbon routes is one of the more consequential industrial choices the continent faces.
1.2 Three routes, three carbon profiles
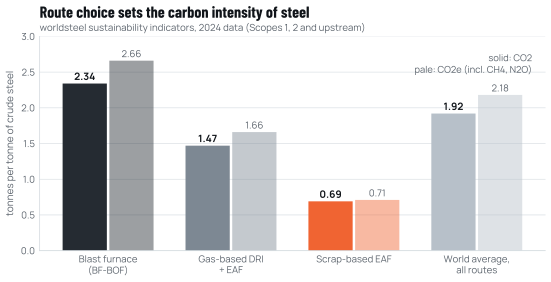
Almost all of the world’s steel is made by one of three routes. Figure 1.1 shows their carbon intensity on worldsteel’s 2024 data, and Table 1.1 summarises how they work.
The blast furnace and basic oxygen furnace (BF-BOF). Iron ore, usually agglomerated as sinter or pellets, is reduced with coke in a blast furnace to make liquid pig iron containing about 4% carbon. A basic oxygen furnace then blows oxygen through the iron to burn off most of that carbon and make steel, with up to about a fifth of scrap added as coolant. The route emits 2.34 t CO2 per tonne of crude steel on average, or 2.66 t CO2e once methane from coal mining and other gases are added [S01]. It dominates world output because it is mature, works at very large scale and uses abundant ore and coal.
Direct reduction with an electric-arc furnace (DRI-EAF). Iron ore pellets are reduced in the solid state in a shaft furnace by a gas rich in hydrogen and carbon monoxide, usually made by reforming natural gas, to produce direct-reduced iron (DRI), a porous metallic product with about 90% to 94% metallic iron. DRI is then melted, often with scrap, in an electric-arc furnace. The worldsteel average for this route is 1.47 t CO2 per tonne (1.66 t CO2e) [S01]. The route is lower-carbon than the blast furnace because natural gas contains more hydrogen and less carbon than coal, and because the same shaft furnace can, in principle, run on an increasing share of hydrogen.
Scrap-based electric-arc furnaces (scrap-EAF). Steel scrap, which is already metallic iron, is melted by an electric arc between graphite electrodes and the charge. No ore is reduced, so the chemistry that makes ironmaking carbon-intensive is avoided. worldsteel’s 2024 average is 0.69 t CO2 per tonne (0.71 t CO2e), most of it from electricity and the remainder from electrodes, charge carbon and lime [S01].
Source: worldsteel, Sustainability Indicators 2025 report, route table added February 2026 [S01].
Table 1.1 The three main routes compared
| Route | What it melts or reduces | CO2, t/t crude steel (2024) | CO2e, t/t (2024) | Energy intensity, GJ/t (worldsteel) | Main carbon source |
|---|---|---|---|---|---|
| BF-BOF | Sinter, pellets, lump ore; coke; up to about 20% scrap | 2.34 | 2.66 | 23.88 | Coke and coal as reductant and fuel |
| DRI-EAF | DR-grade pellets reduced by reformed natural gas; scrap | 1.47 | 1.66 | 23.30 | Natural gas in the shaft furnace; electricity |
| Scrap-EAF | Scrap (more than 70% of charge); some DRI or pig iron | 0.69 | 0.71 | 9.84 | Electricity; electrodes, charge carbon, lime |
| World average | All routes | 1.92 | 2.18 | 20.95 | Dominated by BF-BOF |
Source: worldsteel, Sustainability Indicators 2025 [S01]. worldsteel counts electricity as primary energy, so its energy intensities are higher than the final-energy figures of the IEA [S05].
Two qualifications matter. First, these are global averages. Individual plants range widely around them: a blast furnace with high scrap use and efficient energy recovery may be well below 2.34 t, and a DRI plant that uses coal rather than gas emits far more. The IEA estimates that coal-based DRI emits about three times as much direct CO2 as gas-based DRI [S05], which matters because about 35% of the world’s 151 Mt of DRI in 2025 was made with coal, mostly in Indian rotary kilns [S13]. Second, the electric routes are only as clean as the electricity they use. The scrap-EAF average of 0.69 t reflects a world grid emitting several hundred grams of CO2 per kWh; the same furnace on a hydro grid would emit much less. Chapter 3 quantifies that effect for Cameroon.
1.3 Where the carbon comes from inside each route
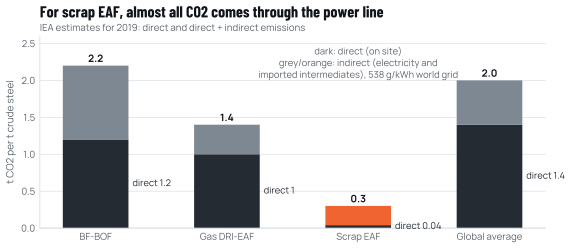
Figure 1.2 uses IEA estimates to separate direct emissions, released on site, from indirect emissions, released where the electricity or purchased intermediates are made. The split matters for accounting (Chapter 2) and for policy: the EU carbon border mechanism, for example, counts direct and precursor emissions of steel but not the emissions of the electricity used to make it (Chapter 5).
Source: IEA, Iron and Steel Technology Roadmap (2020) [S05].
For the blast-furnace route, most of the carbon is direct: the IEA puts direct emissions at about 1.2 t per tonne and the total, including electricity and imported coke and pellets, at about 2.2 t. Gas-based DRI-EAF has about 1.0 t direct and 1.4 t in total. For scrap-based electric furnaces the direct share is tiny, about 0.04 t, while the total reaches about 0.3 t at a 538 g/kWh grid [S05]. The figures differ slightly from worldsteel’s because of vintage and boundary, but the structure is the same.
That structure has a practical consequence for a works like RC-1, whose charge combines scrap with purchased DRI or HBI. Its footprint has three parts of comparable size: a direct part from the furnace (electrodes, charge carbon and lime calcination, and later gas for reheating), an electricity part that depends on the grid, and an upstream part that depends on how the purchased iron units were made. Chapter 4 shows that the third part is the largest.
1.4 The world is shifting towards electric steel, and Africa is already there
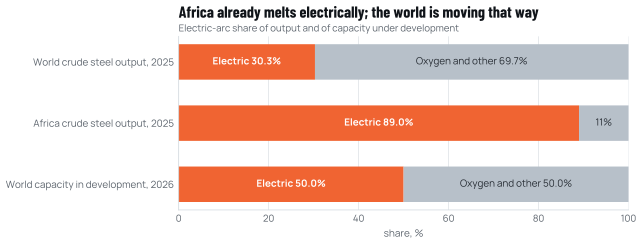
Electric furnaces made 30.3% of the world’s crude steel in 2025, up from 29.1% a year earlier; oxygen converters made 69.4% [S03]. The shift is slow in the installed base but faster in what is being built. Global Energy Monitor’s 2026 survey of plants of 0.5 Mtpa and above found that electric furnaces account for about 34% of operating capacity but about half of the capacity in development and 71% of the projects under construction [S14].
Source: worldsteel, World Steel in Figures 2026 [S03]; Global Energy Monitor, Pedal to the Metal 2026 [S14].
Africa is an outlier in the other direction: 89% of its 29.8 Mt of crude steel in 2025 came from electric furnaces [S03]. The reason is not climate policy. North African producers built gas-based direct reduction on cheap domestic gas, and smaller producers elsewhere melt scrap or imported billets because a blast furnace complex requires a scale, a coking-coal supply and a capital budget that few African markets can support. Algeria alone produced 6.70 Mt of DRI in 2025 and Egypt 6.06 Mt on Midrex plant statistics; on the same statistics Sub-Saharan Africa produced 0.09 Mt, with its gas-based plants idle [S13], while worldsteel, whose figures include estimates for plants outside that survey, puts output in Uganda, Kenya and Tanzania at about 2.7 Mt [S03]. Chapter 6 returns to what that gap means for Central Africa.
The practical implication is that an electric-arc works in Cameroon is not an exotic choice imposed by decarbonisation; it is the regional norm and the global direction of travel. What distinguishes a low-carbon electric works from an ordinary one is not the furnace but the power and the iron units.
1.5 Scrap is the cleanest input, and it is finite
Every tonne of scrap used in place of ore-based iron avoids about 1.5 t of CO2, according to worldsteel [S02]. Around 630 Mt of scrap is used in global steelmaking each year, which the Bureau of International Recycling and worldsteel estimate avoids nearly 950 Mt of CO2 [S68]. Scrap is therefore the most powerful decarbonisation lever the industry already has.
It is also limited. The amount of scrap available in any year depends on how much steel entered use decades earlier and is now reaching the end of its life. Countries that built their infrastructure long ago, such as the United States or the member states of the European Union, generate large volumes of old scrap; countries still building theirs generate little. In Cameroon, the only quantified study put scrap arising at 53,000 to 62,000 t a year using 2006 data [S88], and existing mills report that local scrap covers only about 40% of their needs [S89]. Global studies reach the same conclusion at world scale: even with much higher recycling, primary iron made from ore will remain necessary for decades, which is why the decarbonisation of ironmaking itself, through gas and then hydrogen-based direct reduction, sits at the centre of every credible net-zero pathway for steel [S08][S11].
Table 1.2 What drives a tonne of steel’s footprint, and who controls it
| Driver | Effect on intensity | Who controls it | Where discussed |
|---|---|---|---|
| Production route | Largest: about 0.7 to 2.3 t per tonne between averages | Investor, at the design stage | This chapter; Chapter 4 |
| Grid emission factor | About 0.1 t per tonne for every 100 g/kWh at RC-1’s use of about 960 kWh per tonne | Power system; supply contract | Chapter 3 |
| Carbon content of purchased iron units | About 0.2 to 0.3 t per tonne at RC-1’s 30% DRI share | Purchasing; suppliers | Chapters 4 and 6 |
| Scrap share | About 0.09 t per tonne per 10 points of charge for RC-1 | Scrap market; collection | Chapter 8 |
| Furnace and mill practice | Typically a few hundredths of a tonne | Operations | Chapters 4 and 10 |
Source: worldsteel [S01]; IEA [S05]; WP06 model on the Cameroon Steel reference configuration RC-1 (planning estimate) [S90]. Ranges are indicative.
1.6 What this means for a new works in Cameroon
Three points from this chapter frame the rest of the paper.
First, by choosing an electric-arc route and excluding a blast furnace, RC-1 avoids the largest source of carbon in steelmaking at the design stage. That decision, more than any later improvement, places its footprint in the lower part of the global distribution.
Second, an electric works exports its carbon question to two places: the grid and its suppliers of iron units. A works on a coal-heavy grid, melting coal-based DRI, can emit as much as an average integrated plant. A works on a hydro-dominated grid, melting scrap and gas-based DRI, can emit a third or less. The quality of the power supply contract and the carbon specification of purchased iron units are therefore climate instruments in their own right.
Third, because scrap is scarce in Cameroon and ore is abundant in the region, the long-term question for a Central African works is not only how to melt cleanly but how to make iron cleanly. That is the green-iron question, and it is the subject of Chapter 6.
The next chapter addresses a prior question: before comparing plants or routes, one must be clear about what is being counted. The same works can report numbers that differ by a factor of five depending on the perimeter, and most public confusion about "green steel" begins there.
Sources cited in this chapter
Bracketed markers refer to these sources; the full list is in the annex. Full list of sources
- S04December 2025 crude steel production and 2025 global totals. worldsteel, 23 Jan 2026.worldsteel.org/media/press-releases/2026/december-2025-crude-steel-pro…
- S01Sustainability Indicators 2025 report (2024 data; route table added February 2026). worldsteel, Nov 2025; upd. Feb 2026.worldsteel.org/wider-sustainability/sustainability-indicators/
- S02Climate change and the production of iron and steel (policy paper). worldsteel.worldsteel.org/climate-action/climate-change-and-the-production-of-iro…
- S09Mission Possible sectoral focus: Steel. Energy Transitions Commission, 2019 (Mission Possible, Nov 2018).energy-transitions.org/wp-content/uploads/2020/08/ETC-sectoral-focus-S…
- S05Iron and Steel Technology Roadmap. International Energy Agency, Oct 2020.iea.blob.core.windows.net/assets/eb0c8ec1-3665-4959-97d0-187ceca189a8/…
- S92worldsteel Short Range Outlook, April 2026. worldsteel, 14 Apr 2026.worldsteel.org/media/press-releases/2026/worldsteel-short-range-outloo…
- S03World Steel in Figures 2026. worldsteel, 4 Jun 2026.worldsteel.org/data/world-steel-in-figures/world-steel-in-figures-2026…
- S132025 World Direct Reduction Statistics. Midrex Technologies, Sep 2026.midrex.com/world-dri-statistics/world-dri-production-reaches-151-0-mt-…
- S14Pedal to the Metal 2026. Global Energy Monitor, May 2026.globalenergymonitor.org/sites/default/files/2026-05/Pedal%20to%20the%2…
- S68Global recycled steel use reaches 630 million tonnes (BIR, World Steel Recycling in Figures). Recycling Product News, 2026.recyclingproductnews.com/article/43829/global-recycled-steel-use-reach…
- S88La récupération et le recyclage des déchets ferromagnétiques: analyse de la situation au Cameroun (Bidoung, Fomethe, Yantio, Melo), Déchets: revue francophone d’écologie industrielle no. 48. ENSP Yaoundé / MIPROMALO (Episciences), Q4 2007.eid.episciences.org/7942/pdf
- S89Cameroun: le groupe Prometal décroche 26 milliards FCFA auprès d’Afreximbank. Sikafinance, 30 Sep 2026.sikafinance.com/marches/cameroun-le-groupe-prometal-decroche-26-millia…
- S08Making Net-Zero Steel Possible. Mission Possible Partnership, Sep 2022.missionpossiblepartnership.org/action-sectors/steel
- S1115 Insights on the Global Steel Transformation. Agora Industry, 15 Jun 2023.agora-industry.org/publications/15-insights-on-the-global-steel-transf…
- S90Cameroon Steel reference configuration RC-1 (planning estimate): phases, planning values, balances and indicative schedule, edition 10 October 2026. Cameroon Steel, 10 Oct 2026.Cited by title and date
Cite this chapter
Cameroon Steel (2026). Lower-carbon steel from Cameroon: it could reach a third of the world’s carbon intensity. White paper 06, chapter 1: Steel and climate: the route decides. CS-WP-06. https://www.cameroon-steel.com/en/library/lower-carbon-steel/steel-and-climate/
Source