White paper 05 · Chapter 9
An electric steelworks at Kribi can be supplied in three steps: grid power first, firm gas-backed capacity for growth, gas for iron last
Cameroon Steel’s reference configuration RC-1 indicates an energy demand that rises from about 289 to 302 GWh of electricity a year, an average load of 36 to 38 MW and no gas in Phase 1, to about 753 to 796 GWh, 94 to 99 MW and 0.91 PJ of reheating gas at 1 Mtpa, before any direct-reduction module; the ranges run from the planning value of 450 kWh per tonne in the furnace to the upper value of about 490. These are planned, indicative values. A three-step energy plan matches that growth to Kribi’s infrastructure: a dedicated 225 kV connection with on-site compensation for Phase 1; firm, gas-backed capacity in the port substation’s later stage for Phases 2 and 3; and a gas allocation for direct reduction only once reserves are certified. Managed well, the plant’s schedulable load, with melting timed around the grid’s peaks, can make it a useful partner for a hydro-based grid, but it cannot offer sustained interruption.
In this chapter (7)
- 9.1 RC-1’s indicative demand by phase
- 9.2 Melting is half to two-thirds of the electricity
- 9.3 The load swings by 30 to 35 MW within each hour
- 9.4 A three-step energy plan
- 9.5 What the electricity would cost in Phase 1
- 9.6 Schedulable load can make the steelworks a partner for the grid, within limits
- 9.7 Energy management inside the plant
9.1 RC-1’s indicative demand by phase
RC-1 is the reference configuration Cameroon Steel uses to plan its steel complex at Mboro. It is phased. Phase 1 is a bar and wire-rod works with a nameplate capacity of about 0.3 Mtpa of finished products and an expected sustained output of 270,000 to 300,000 t a year, built around one electric arc furnace of the 40 t class, a ladle furnace, a billet caster, induction billet heating, a rebar mill and a high-speed wire-rod mill. Its melt shop makes billets, and output can be flexed between rolled products and merchant billets for the re-rollers that today import about 60% of their charge (billet imports were 161 kt in 2023) [S32][S11]. Because domestic rebar capacity, about 627 kt, is already three and a half times demand of about 180 kt [S107], Phase 1’s tonnage is aimed at replacing imported billets and wire rod and at CEMAC exports, not at new rebar sales (White papers 04 and 09). Phase 2 adds a second melt line and a light and medium sections mill for about 0.2 Mtpa. Phase 3 adds melt-shop capacity and a heavy-sections and H-beam mill for about 0.5 Mtpa, bringing the complex to about 1 Mtpa. A direct-reduction module for Cameroonian ore is held in reserve [S07]. Table 9.1 gives the energy balance that follows from RC-1’s planning values.
Table 9.1 RC-1 indicative energy and utilities balance by phase (planned and indicative values)
| Indicator | Phase 1 | Phases 1 and 2 | Full build-out | Status |
|---|---|---|---|---|
| Finished products (t/yr), nameplate | 300,000 | 500,000 | 1,000,000 | planned |
| Expected sustained output, Phase 1 (t/yr) | 270,000 to 300,000 | not yet estimated | not yet estimated | derived |
| Liquid steel (t/yr) | 319,149 | 531,915 | 1,063,830 | derived |
| Metallic charge (t/yr) | 362,669 | 604,449 | 1,208,897 | derived |
| of which imported DRI or HBI at a 30% share (t/yr) | 108,801 | 181,335 | 362,669 | assumed share |
| Electricity at 450 kWh/t in the furnace (MWh/yr) | 288,957 | 421,596 | 753,191 | derived |
| Electricity at the upper value of about 490 kWh/t (MWh/yr) | 301,723 | 442,872 | 795,745 | derived |
| Electricity per tonne of product (MWh/t) | 0.96 to 1.01 | 0.84 to 0.89 | 0.75 to 0.80 | derived |
| Average load at 8,000 h/yr (MW) | 36.1 to 37.7 | 52.7 to 55.4 | 94.1 to 99.5 | derived |
| Maximum demand (MVA) | 55 (45 to 65) | about 85 to 110 (derived) | 160 (130 to 190) | assumed |
| Reheating gas (GJ/yr) | 0 | 260,000 | 910,000 | derived |
| Reheating gas (bcf/yr) | 0 | 0.24 | 0.83 | derived |
| Oxygen (million Nm3/yr) | 11.2 | 18.6 | 37.2 | derived |
| Scope 2 emissions at 226 g/kWh (t CO₂/yr) | 65,304 | 95,281 | 170,221 | derived |
| Scope 1 and 2 intensity (t CO₂/t product) | 0.32 | 0.33 | 0.33 | derived |
Source: Cameroon Steel reference configuration RC-1 (planning estimate), edition 10 October 2026: capacities, benchmarks and balances at nameplate [S07]; upper-value rows at about 490 kWh/t in the furnace and the sustained-output range derived (Annex A; White paper 03, Chapter 5); maximum demand for Phases 1 and 2 as interpolated in White paper 03, Chapter 9 (derived); Scope 2 and intensity at 450 kWh/t, about 0.01 t higher at 490; gas converted at 1.094 GJ per Mscf. Values are planned or indicative and will change with front-end engineering.
Three features of this balance shape the energy plan:
- Phase 1 is all-electric. Billets are heated by induction, so Phase 1 needs no gas contract [S07].
- Electricity per tonne falls as the works grows, from 0.96 to 0.75 MWh/t, because the later mills reheat with gas and because induction heating is confined to the Phase 1 mills.
- Gas arrives with Phase 2, at about 0.24 bcf a year, and reaches about 0.83 bcf at full build-out, a small fraction of the 4.9 bcf the Kribi power plant used in 2025 [S05].
9.2 Melting is half to two-thirds of the electricity
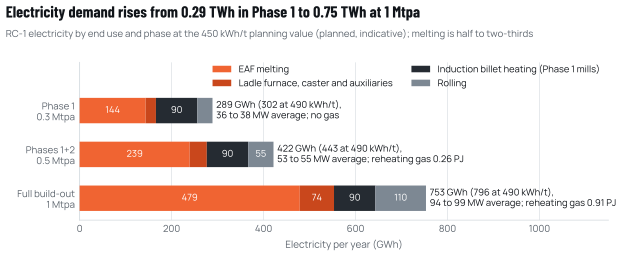
Figure 9.1 breaks the electricity demand down by end use.
Source: Cameroon Steel reference configuration RC-1 (planning estimate): 450 kWh/t liquid for the EAF (upper value about 490), 70 kWh/t liquid for the ladle furnace, caster and auxiliaries, 300 kWh/t billet for induction heating of the Phase 1 mills, 110 kWh/t product for rolling [S07].
In Phase 1, the arc furnace takes about 144 GWh a year (50%) at the planning value, or about 156 GWh at the upper value, induction heating about 90 GWh (31%), rolling about 33 GWh (11%) and the ladle furnace and auxiliaries about 22 GWh (8%). At full build-out, the arc furnaces take about 479 GWh (64%), rolling about 110 GWh, the ladle furnaces and auxiliaries about 74 GWh and induction heating still about 90 GWh (derived from [S07]).
The planning values carry real uncertainty. Using the low and high ends of RC-1’s benchmark ranges (347 to 500 kWh/t for the furnace, 50 to 100 for auxiliaries, 150 to 400 for induction heating, 70 to 140 for rolling), Phase 1 electricity would range from about 193 to 354 GWh a year (derived). The furnace’s charge also matters. Read as an all-scrap value, the 450 kWh/t planning value rises by about 14.5 kWh/t for each 10% of DRI in the charge [S39], which is why this paper carries about 490 kWh/t, and about 302 GWh a year in Phase 1, as the upper planning value for RC-1’s 30% DRI or HBI [S07]. Raising the DRI share further, to 50%, would add another 29 kWh per tonne, about 9 GWh a year. A supply contract for Phase 1 should therefore be written around a range, with a mechanism to adjust contracted capacity after the first year of operation.
9.3 The load swings by 30 to 35 MW within each hour
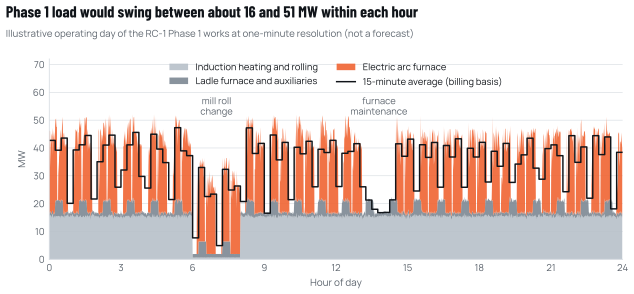
Average loads hide the shape that matters for the grid. Figure 9.2 is an illustrative operating day of the Phase 1 works, built from RC-1’s planning values at one-minute resolution.
Source: Cameroon Steel illustration from RC-1 benchmarks: heats of about 40 t and about 18 MWh (450 kWh/t) at roughly one per hour; induction heating 11.25 MW and rolling 4.13 MW while the mill runs; auxiliaries 1.3 MW plus ladle-furnace pulses [S07]. Not a forecast.
Three numbers from this illustration are useful for contracting (derived):
- the steady base of about 16 to 18 MW (mill, induction heating and auxiliaries) runs whenever the mill runs;
- the furnace adds 20 to 30 MW for about 45 minutes in every hour, so the instantaneous load moves by about 30 to 35 MW within each cycle;
- the 15-minute average peaks at about 47 MW, against a planned maximum demand of 55 MVA (45 to 65) [S07]. The ratio of average load to maximum demand is about 65% to 70%, which is why the structure of the capacity charge matters (Chapter 3).
The illustration also shows the two kinds of planned stoppage that a supply contract must accommodate: a mill stop, for example for a roll change, which removes the steady base for an hour or two, and a furnace stop for maintenance, which removes the fluctuating component. Each is a step change of 15 to 30 MW that the grid operator should know about in advance.
9.4 A three-step energy plan
Table 9.2 sets out a plan that matches each phase of the steelworks to the energy infrastructure available at Kribi and to the policy steps proposed in Chapter 10.
Table 9.2 A phased energy plan for an electric steelworks at Kribi (indicative)
| Element | Step 1: Phase 1 (works from 2029, first heat H2 2030) | Step 2: Phases 2 and 3 (indicative, from 2032) | Step 3: DRI reserve (after 2034, indicative) |
|---|---|---|---|
| Grid connection | Dedicated 225 kV bay at the port substation; 225/33 kV plant substation | Extension within the substation’s 330 to 400 MW stage | As step 2 |
| Contracted capacity | About 55 MVA (45 to 65) | Up to about 160 MVA (130 to 190) | Plus the DRI module’s load |
| Energy supply | Large-user contract with the utility or an independent producer | Add firm gas-backed capacity at the Kribi gas plant | As step 2; hydro supply for hydrogen blending later |
| Power quality | SVC or STATCOM and filters from a connection study | Extend for further furnaces (cubic flicker summation) | As step 2 |
| Gas | None | 0.24 to 0.83 bcf/yr for reheating, by pipeline from the gas plant | About 8.4 to 9.1 bcf/yr for 1 Mtpa of DRI |
| Renewables | On-site solar where economic; hydro attribute if wheeling rules allow | Long-term hydro contract linked to new capacity | Hydrogen-ready shaft furnace |
| Essential loads | Standby generators and battery ride-through | Extend | Extend |
| Flexibility | Melting scheduled around peaks; capped emergency load-shedding | As step 1, across several furnaces | DRI module can modulate within limits |
| Policy prerequisite | Large-user tariff; grid code for fluctuating loads | Gas allocation; wheeling rules | Certified reserves; DRI gas price formula |
Source: Cameroon Steel analysis; Cameroon Steel reference configuration RC-1 (planning estimate) [S07]; PAK [S14]; gas volumes derived (Chapters 6 and 7).
Step 1 relies only on infrastructure that will exist by the end of 2026: the 225 kV line and substation [S14]. Its critical needs are contractual (a large-user supply contract) and technical (the connection study and compensation). It needs no gas, which insulates the first phase from the uncertainty created by the FLNG’s departure.
Step 2 depends on two things outside the plant: the substation’s later stage of 330 to 400 MW, and firm thermal capacity to cover dry seasons and transmission outages. The natural source of that capacity is the Kribi gas plant, through a dedicated part of its output or an extension within its 330 MW licence [S21][S22], which in turn requires a gas allocation. Reheating gas for the sections mills is small and could be delivered by a pipeline spur from the gas plant.
Step 3 depends on the gas and ore conditions set out in Chapter 7. It should not be a planning assumption until reserves are certified and a DR-grade pellet supply is identified.
9.5 What the electricity would cost in Phase 1
At the three price benchmarks used in this paper, Phase 1’s electricity bill at the planning value of 289 GWh would differ by a factor of almost six (derived from [S07][S01][S03][S04]); at the upper value of about 302 GWh each figure is about 4% higher:
- at the legacy high-voltage average of 18.4 FCFA/kWh, about 5.3 bn FCFA a year;
- at the 2026 all-in price of the 9 to 10 MW MV band, 43.7 FCFA/kWh, about 12.6 bn FCFA a year, and about 16.4 bn FCFA at the 56.7 FCFA/kWh that the same structure would imply for the plant’s peaky load shape;
- at the regulator’s cost-reflective average of 105.46 FCFA/kWh, about 30.5 bn FCFA a year.
For comparison, Cameroon’s largest existing steel group, Prometal, paid about 8.37 bn FCFA for electricity in 2024 for a load of about 40 MW [S42]. These are indicative operating-cost figures based on public price benchmarks, not estimates of any contract. They show why the price framework of Chapter 3 is the single largest energy variable in the plant’s economics, larger than any plausible gain from energy efficiency inside the plant, and why the structure of the capacity charge matters as much as the energy price. White paper 04 (Chapter 8) places this power cost beside the cost of metallics and conversion in an indicative comparison of a Kribi billet with an imported one.
9.6 Schedulable load can make the steelworks a partner for the grid, within limits
An arc-furnace steelworks is often seen as a problem for a grid. On a hydro-based system with seasonal shortfalls, it can also be part of the solution, because part of its load can be moved within the day at low cost.
This flexibility is schedulable, not interruptible. A single furnace needs about 7,300 to 7,900 hours a year to cast Phase 1’s nameplate tonnage (White paper 03, Chapter 5), so each hour of curtailment beyond the planned non-melting hours costs about one heat (about 40 t) that cannot be recovered later: about 4,000 t of liquid steel, some 1.3% of nameplate liquid output, for every 100 hours (derived). On a system with a peak of 1,278 MW [S01], moving the furnace’s 20 to 30 MW out of the evening peak is worth about 1.6% to 2.3% of peak demand, a useful contribution for a grid that left 150 MW of industrial demand unserved in 2026 [S02]. The large-user framework should therefore reward scheduling, through time-of-use energy prices or a capacity charge measured at the system peak, and cap any emergency load-shedding in hours and events a year, with notice that lets the heat in progress be finished safely.
9.7 Energy management inside the plant
The plant’s own practices determine where it falls within the benchmark ranges. The main levers in an electric steelworks are well known:
- Furnace practice. Continuous charging with scrap preheating, as in the Consteel process, has achieved about 321 kWh/t with power savings of 10% to 15% and electrode consumption below 1 kg/t [S38]; good scrap preparation and foamy-slag practice reduce energy and flicker together.
- Hot charging. Synchronising the caster and mill so that billets reach the induction heaters still hot reduces Phase 1’s induction energy towards the low end of its 150 to 400 kWh/t range [S07].
- Metering and monitoring. Sub-metering of every major consumer, with real-time dashboards for kWh per tonne, power-on time, electrode use and power quality at the point of common coupling, turns benchmarks into daily targets.
- Reporting. Publishing energy intensity and Scope 2 emissions annually, on both the location-based and market-based methods, supports the low-emission positioning described in Chapter 8.
Sources cited in this chapter
Bracketed markers refer to these sources; the full list is in the annex. Full list of sources
- S32Cameroun: le groupe Prometal décroche 26 milliards FCFA auprès d’Afreximbank…. Sikafinance, 30 Sep 2026.sikafinance.com/marches/cameroun-le-groupe-prometal-decroche-26-millia…
- S11UN Comtrade public API, Cameroon (reporter 120), HS 72/73 and 6-digit lines, 2019-2023. UN Statistics Division.comtradeapi.un.org/public/v1/preview/C/A/HS?reporterCode=120&period=20…
- S107Production: les acteurs en présence. Cameroon Tribune, 11 May 2026.cameroon-tribune.cm/article.html/76600/fr.html/details_2
- S07Cameroon Steel reference configuration RC-1 (planning estimate), edition 10 October 2026 (RC-1.1): phases, benchmarks with ranges, indicative balances and schedule. Cameroon Steel, 10 Oct 2026.Cited by title and date
- S05Données pétrolières 2025. SNH, posted Jun 2026.snh.cm/wp-content/uploads/2026/06/Donnees-petrolieres-2025.pdf
- S39ENERGIRON technology (DRI-EAF with natural gas or H₂). EC ICIT, ref. 12 Feb 2026.innovation-centre-for-industrial-transformation.ec.europa.eu/innovativ…
- S14Kribi franchit la ligne électrique 225 kV. PAK, 6 Aug 2025.Cited by title and date
- S21Kribi Power Development Corporation. MIGA (World Bank Group), 2014.miga.org/project/kribi-power-development-corporation-0
- S22The AfDB praises the impacts of the planned extension of the Kribi gas-fired power plant. Business in Cameroon, 1 Jul 2020.businessincameroon.com/energy/0107-10486-the-afdb-praises-the-impacts-…
- S01Rapport d’activités 2025 de l’ARSEL. ARSEL (electricity regulator), 7 Sep 2026.arsel-cm.org/wp-content/uploads/2026/09/Rapport-ARSEL-2025.pdf
- S03Tableaux tarifaires, Décision ARSEL N°00000427 (MT 2023-2025). ARSEL, uploaded Jan 2026.arsel-cm.org/wp-content/uploads/2026/01/TABLEAUX-TARIFAIRES-decision-M…
- S04Décision fixant le montant de la RMA ENEO au titre de l’exercice 2025 (réajustée). ARSEL, 19 Dec 2025.arsel-cm.org/wp-content/uploads/2026/01/Decision-fixant-le-Montant-de-…
- S42Prometal, Acero Metal, Aciéries du Cameroun… qui est le plus gros consommateur d’électricité de la métallurgie camerounaise. EcoMatin, 15 Jul 2026.ecomatin.net/prometal-acero-metal-acieries-du-cameroun-qui-est-le-plus…
- S02Nachtigal power line delays leave 150 MW of industrial demand unmet. Business in Cameroon, 9 Oct 2026.businessincameroon.com/public-management/0910-16939-nachtigal-power-li…
- S38Enhanced EAF steelmaking through continuous charging (Consteel). EC ICIT, n.d., accessed Oct 2026.innovation-centre-for-industrial-transformation.ec.europa.eu/innovativ…
Cite this chapter
Cameroon Steel (2026). Cameroon’s hydro grid can power low-carbon steel if large users get firm supply, clear tariffs and gas. White paper 05, chapter 9: An electric steelworks at Kribi can be supplied in three steps: grid power first, firm gas-backed capacity for growth, gas for iron last. CS-WP-05. https://www.cameroon-steel.com/en/library/energy-for-industry/energy-plan/
Source