White paper 05 · Chapter 1
Energy decides the cost and the carbon of electric steel
For an electric steelworks, energy is the largest cost that the plant’s own decisions can change. A bar and wire-rod works of the RC-1 Phase 1 type would use about 0.96 to 1.0 MWh of electricity per tonne of product; across the prices observed in Cameroon in 2025 and 2026, that is US$30 to US$170 a tonne, a spread equal to about a fifth of the export price of rebar. The price of electricity, and how firmly it is delivered, therefore decide whether such a plant competes with imports.
In this chapter (7)
- 1.1 Energy is 20% to 40% of the cost of making steel
- 1.2 Three routes to steel have three very different energy profiles
- 1.3 Melting takes most of the electricity in an electric steelworks
- 1.4 Phase 1 is planned without gas, which trades a gas risk for a power load
- 1.5 The tariff can move the cost of a tonne of steel by US$140
- 1.6 Energy also sets the carbon footprint, which buyers and border rules increasingly price
- 1.7 What this means for policy and for investors
1.1 Energy is 20% to 40% of the cost of making steel
The World Steel Association (worldsteel) estimates that energy accounts for 20% to 40% of the cost of steel production, and attributes a reduction of about 60% in the energy needed per tonne of crude steel since 1960 to efficiency gains [S31]. The range is wide because it covers very different plants. An integrated works that starts from iron ore and coking coal buys most of its energy as coal. An electric steelworks buys it mainly as electricity, and, if it makes its own iron, as natural gas.
In an electric arc furnace (EAF) plant, the largest single cost is the metallic charge: the scrap, direct-reduced iron (DRI), hot-briquetted iron (HBI) or pig iron that is melted. Electricity comes next, followed by graphite electrodes, alloys, refractories, oxygen and labour. The metallic charge is priced on world markets and is largely outside a plant’s control. Electricity is different: it is bought locally, under contracts and tariffs that national policy shapes. In Cameroon, where no regulated tariff is published for loads above 10 MW [S01], the electricity price for a large steelworks is not a market datum but the outcome of a negotiation with the utility and the regulator.
This matters more in Cameroon than in most steel markets, for two reasons that recur throughout this paper:
- The country is short of iron units, not of rolling capacity. Cameroon’s rolling mills run at about half of their roughly 1.2 Mt of installed transformation capacity [S32][S33], local scrap covers only about 40% of their needs [S32], and billets were the largest steel import in 2023, at 161 kt, 78% of them from Indonesia [S11]. Any plant that adds iron units, by melting more scrap or by making DRI, adds energy demand: electricity for melting, gas for reduction.
- The power system is hydro-based and the gas system has just lost its main buyer. About 90% of Cameroon’s electricity came from hydro in 2025 [S01], and the floating liquefaction vessel that took about 95% of the country’s gas output left Kribi in July 2026 [S05][S16]. Both facts change what an energy-intensive plant can expect, and are developed in Chapters 2 and 6.
1.2 Three routes to steel have three very different energy profiles
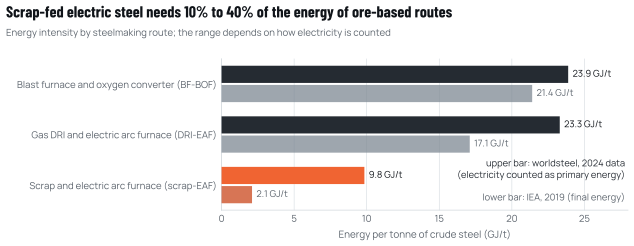
Steel is made by three main routes, and each has a distinct energy signature (Figure 1.1).
- Blast furnace and basic oxygen furnace (BF-BOF). Iron ore is reduced to liquid pig iron in a blast furnace, using coke made from coking coal, then refined to steel in an oxygen converter. Most of the energy is coal, and most of the emissions are direct.
- Direct reduction and electric arc furnace (DRI-EAF). Iron ore pellets are reduced in the solid state, usually in a shaft furnace, by a gas made from natural gas (or, in future, hydrogen). The DRI is then melted in an EAF. Gas supplies the chemistry of reduction; electricity supplies the melting.
- Scrap and electric arc furnace (scrap-EAF). Recycled steel is melted directly. No reduction is needed, so the energy demand is mostly electricity for melting.
Source: worldsteel, Sustainability Indicators 2025 (2024 data) [S34]; IEA, Iron and Steel Technology Roadmap (2020) [S35].
On worldsteel’s basis, the 2024 energy intensities were 23.88 GJ per tonne of crude steel for BF-BOF, 23.30 GJ/t for DRI-EAF and 9.84 GJ/t for scrap-EAF [S34]. The IEA’s final-energy figures are 21.4, 17.1 and 2.1 GJ/t respectively [S35]. The two sets differ mainly because worldsteel converts each MWh of electricity into about 9.8 GJ of primary energy, while the IEA counts the MWh itself [S35]. Whichever basis is used, the ranking is stable: making iron from ore is energy-intensive, and melting scrap is not.
The same ranking applies to carbon. worldsteel’s 2024 intensities are 2.34 t CO₂ per tonne of crude steel for BF-BOF, 1.47 t for DRI-EAF and 0.69 t for scrap-EAF, against a world average of 1.92 t [S34]. For the two electric routes, a large part of the footprint is the electricity itself, which is why the carbon content of the grid matters so much (Section 1.6 and Chapter 8).
1.3 Melting takes most of the electricity in an electric steelworks
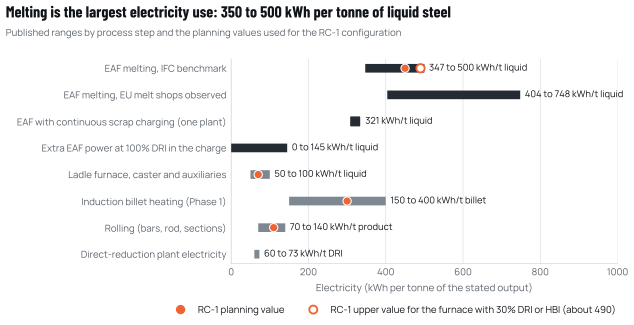
Inside an electric steelworks, electricity is used at five main points. Figure 1.2 shows the published ranges for each, and the planning values that Cameroon Steel uses for its reference configuration RC-1 (Table 1.1).
Source: IFC, EHS Guidelines for Integrated Steel Mills (2007) [S36]; European Commission, Iron and Steel BREF (2013) [S37]; EC Innovation Centre for Industrial Transformation (ICIT), Consteel and Energiron fact sheets [S38][S39]; Cameroon Steel reference configuration RC-1 (planning estimate) [S07]; upper planning value derived (Annex A).
The arc furnace. The International Finance Corporation (IFC) benchmark for EAF melting is 1,250 to 1,800 MJ per tonne of liquid steel, which is 347 to 500 kWh/t [S36]. European melt shops reported 404 to 748 kWh/t in the reference document on best available techniques, with electrode consumption of 2 to 6 kg/t [S37]. Continuous charging with scrap preheating can bring the figure lower: one plant using the Consteel process reported 321 kWh/t, with power savings of 10% to 15% and electrode use below 1 kg/t [S38]. RC-1 uses 450 kWh/t as its planning value, within the IFC range of 347 to 500 kWh/t [S07].
The penalty for ore-based iron in the charge. DRI carries residual oxides and gangue that must be melted and slagged off. The Energiron fact sheet indicates that each additional 10% of DRI in the charge raises EAF electricity by about 14.5 kWh/t [S39]; extrapolated, an all-DRI charge needs about 145 kWh/t more than an all-scrap charge (derived). RC-1 plans a charge with about 30% imported DRI or HBI, within a range of 20% to 50% [S07]. Read as an all-scrap value, the 450 kWh/t planning value plus the increment for 30% DRI gives about 494 kWh/t. This paper therefore carries two values throughout, as White paper 03 does: 450 kWh/t as the RC-1 planning value and about 490 kWh/t as the upper planning value with 30% DRI or HBI in the charge (derived).
The ladle furnace and auxiliaries. After tapping, steel is refined and brought to casting temperature in a ladle furnace (LF), then cast into billets. The oxygen plant, water treatment, compressed air and buildings add to the load. RC-1 assumes 70 kWh per tonne of liquid steel for all of these together, in a range of 50 to 100 kWh/t [S07]. Oxygen use is planned at about 35 Nm3 per tonne of liquid steel [S07].
Rolling. The mill that turns billets into bars, rod or sections uses 70 to 140 kWh per tonne of product on the IFC benchmark [S36]; the European Union’s 2022 best-available-techniques conclusions for ferrous metals processing give 100 to 500 MJ/t for bars and rods, about 28 to 139 kWh/t [S40]. RC-1 uses 110 kWh/t [S07].
Reheating. Billets must be heated to rolling temperature. Gas-fired reheating furnaces for bars and rods use 600 to 1,900 MJ/t, and 1,400 to 2,200 MJ/t for beams and blooms, on the EU benchmark [S40]. RC-1 plans electric induction heating in Phase 1 and a gas-fired walking-beam furnace for the sections mills of Phases 2 and 3, at about 1.3 GJ per tonne of product [S07].
Table 1.1 Energy inputs by process step, benchmarks and RC-1 planning values
| Process step | Energy carrier | Published benchmark | RC-1 planning value | Status |
|---|---|---|---|---|
| EAF melting | Electricity | 347 to 500 kWh/t liquid (IFC); 404 to 748 (EU) | 450 kWh/t liquid | sourced |
| EAF melting, upper planning value | Electricity | +14.5 kWh/t per +10% DRI on an all-scrap base | about 490 kWh/t liquid with 30% DRI or HBI | derived |
| DRI in the charge | Electricity | +14.5 kWh/t per +10% DRI | 30% DRI or HBI (20% to 50%) | sourced / assumed |
| Electrodes | Graphite | 2 to 6 kg/t liquid (EU) | not modelled | sourced |
| Ladle furnace, caster, auxiliaries | Electricity | not benchmarked as a group | 70 kWh/t liquid (50 to 100) | assumed |
| Oxygen | Electricity (air separation) | not benchmarked here | 35 Nm3/t liquid (25 to 45) | assumed |
| Induction billet heating (Phase 1) | Electricity | vendor ranges vary with hot charging | 300 kWh/t billet (150 to 400) | assumed |
| Gas-fired reheating (Phases 2 and 3) | Natural gas | 0.6 to 2.2 GJ/t (EU, by product) | 1.3 GJ/t product (1.1 to 1.6) | sourced / assumed |
| Rolling | Electricity | 70 to 140 kWh/t product (IFC) | 110 kWh/t product | sourced |
| Direct reduction (reserve) | Natural gas, electricity | 9.2 to 10 GJ and about 73 kWh per t DRI | 10 GJ/t DRI (9.2 to 10) | sourced / assumed |
Source: IFC 2007 [S36]; EU BREF 2013 [S37]; Commission Implementing Decision (EU) 2022/2110 [S40]; EC ICIT Energiron [S39]; Danieli, Suez Steel 2026 [S41]; Cameroon Steel reference configuration RC-1 (planning estimate) [S07].
Added together on RC-1 planning values, Phase 1 would use about 289 GWh of electricity a year for its nameplate output of 300,000 t of finished products, or 0.96 MWh per tonne, and no gas [S07]; at the upper planning value of about 490 kWh/t in the furnace, about 302 GWh, or 1.0 MWh per tonne (derived). At full build-out to 1 Mtpa, electricity would rise to about 753 to 796 GWh a year, or 0.75 to 0.80 MWh per tonne, because the later phases reheat with gas rather than induction, and gas use would reach about 0.91 PJ a year [S07]. Chapter 9 sets out the full phase-by-phase balance.
1.4 Phase 1 is planned without gas, which trades a gas risk for a power load
RC-1 plans to heat billets for its first rolling mills by induction rather than in a gas-fired furnace [S07]. That design choice has three effects that bear directly on this paper.
First, Phase 1 needs no gas allocation at all. Reheating 300,000 t of billets in a gas furnace at 1.3 GJ/t would burn about 0.39 PJ a year, around 0.36 bcf (derived). Using induction instead removes the plant’s dependence on a gas contract in the years when Cameroon’s gas sector is being restructured after the departure of the Hilli FLNG (Chapter 6).
Second, it adds about 90 GWh a year to the power demand, some 31% of Phase 1’s electricity (derived from 300 kWh/t on 300,000 t). In energy terms the two options are close: 300 kWh is 1.08 GJ, against 1.3 GJ of gas, because induction puts heat directly into the billet while a furnace loses much of it through the flue. In cost terms, the comparison depends entirely on the electricity tariff and the gas price, which is why both are analysed in this paper.
Third, induction heating suits hot charging. Billets that leave the caster still hot need only a top-up to reach rolling temperature, so the actual energy use depends on how closely the caster and mill are synchronised. The planning range of 150 to 400 kWh/t reflects that uncertainty [S07].
1.5 The tariff can move the cost of a tonne of steel by US$140
The electricity cost per tonne follows from the plant’s intensity and the price paid. Cameroon has no published tariff for loads of the size of a steelworks, so Table 1.2 uses three benchmarks that are developed in Chapter 3: the average price actually realised on the six legacy high-voltage (HV) contracts in 2025, 18.4 FCFA/kWh; the all-in price of the highest published medium-voltage (MV) band, 9 to 10 MW, in 2026, about 43.7 FCFA/kWh; and the regulator’s cost-reflective average for 2025, 105.46 FCFA/kWh [S01][S03][S04].
Table 1.2 Electricity cost per tonne of product at three price benchmarks (derived)
| Price benchmark | FCFA/kWh | Phase 1, 0.96 MWh/t: FCFA/t | Phase 1: US$/t | Full build-out, 0.75 MWh/t: US$/t | Phase 1 cost as share of rebar at US$625/t |
|---|---|---|---|---|---|
| Legacy HV contracts, average realised, 2025 | 18.4 | 17,723 | 29.5 | 23.1 | 4.7% |
| MV 9 to 10 MW band, all-in, 2026 | 43.7 | 42,091 | 70.2 | 54.9 | 11.2% |
| Cost-reflective average, 2025 | 105.46 | 101,578 | 169.3 | 132.4 | 27.1% |
Source: ARSEL 2025 annual report [S01]; ARSEL tariff tables [S03]; ARSEL decision of 19 December 2025 [S04]; RC-1 balances at the 450 kWh/t planning value [S07]; Turkish rebar export price US$620 to 630/t FOB, 3 October 2026 [S09]. US$ at 600 FCFA (planning rate). Electricity only, excluding VAT, reactive-energy charges and connection costs. At the upper planning value of about 490 kWh/t, Phase 1 costs are about 4% higher.
The spread between the first and last rows is about US$140 per tonne of product in Phase 1. White paper 04 (Chapter 8) sets these power costs beside the cost of metallics and conversion in an indicative comparison of a Kribi billet with an imported one. For comparison, Turkish rebar was offered for export at US$620 to US$630 a tonne FOB on 3 October 2026, and Chinese billets at US$465 to US$470 [S09]. A steelworks paying the cost-reflective average would spend more than a quarter of the value of its product on electricity; one paying the legacy HV price would spend under 5%.
The existing steel industry already feels this. Cameroon’s metallurgical plants paid substantial electricity bills in 2024: about 8.37 bn FCFA for Prometal, 3.81 bn for Metafrique, 3.11 bn for Acero Metal and 1.61 bn for Aciéries du Cameroun [S42]. Prometal, which operates an arc-furnace melt shop at Douala described as the first of its kind in Central Africa [S43], has a load of about 40 MW and moved to a high-voltage supply through an access contract with the transmission company SONATREL, with a dedicated 50 MVA transformer [S42][S01]. When tariffs for large accounts rose in January 2023, the steel producers protested publicly against a feared increase of about 30%, while the regulator, the Agence de Régulation du Secteur de l’Électricité (ARSEL), put the average increase for MV bills at 12% [S44][S45]. The episode shows how sensitive the sector is to the tariff and how little predictability large users currently have.
1.6 Energy also sets the carbon footprint, which buyers and border rules increasingly price
For an electric steelworks, the electricity supply largely determines the indirect (Scope 2) emissions. At Cameroon’s 2024 average grid intensity of about 226 g CO₂e per kWh [S10], Phase 1’s 0.96 MWh/t would carry about 0.22 t CO₂ per tonne of product (about 0.23 t at 1.0 MWh/t). On a grid at the 2024 world average of about 471 g/kWh [S10], the same plant would carry about 0.45 t, and on Indonesia’s grid, at about 680 g/kWh, about 0.65 t (derived).
RC-1’s own estimate, which adds the direct (Scope 1) emissions from electrodes, charge carbon and lime, is about 0.32 t CO₂ per tonne of product for Scopes 1 and 2, and about 0.58 t when the upstream emissions of the imported DRI are included [S07]; the upper planning value adds about 0.01 t (derived; White paper 06 sets out the full carbon balance). Both are well below the worldsteel route averages for DRI-EAF (1.47 t) and BF-BOF (2.34 t), and below the scrap-EAF average (0.69 t) [S34].
Carbon now has a price at Europe’s border. The European Union’s Carbon Border Adjustment Mechanism (CBAM) entered its definitive phase on 1 January 2026, covers all of chapter 72 of the Combined Nomenclature, including billets, rebar, wire rod and DRI, and set a certificate price of €82.32 per tonne of CO₂e for the third quarter of 2026 [S30][S46][S47]. For iron and steel, CBAM currently counts direct emissions only [S46], so at that price every 0.1 t of direct CO₂ per tonne of steel is worth about €8 a tonne at the EU border before deductions (derived). The carbon content of the electricity matters instead for customers’ supply-chain reporting and for low-emission steel standards; Chapter 8 explains why a contracted hydro supply is worth more to an exporter than the grid average.
1.7 What this means for policy and for investors
The economics of electric steel in Cameroon reduce to three energy questions, which the following chapters answer in turn:
- Is there enough firm power, delivered with the quality an arc furnace needs? Chapters 2, 4 and 5 show that Cameroon has capacity on paper, but that delivering firm, high-quality supply to a large fluctuating load requires dedicated transmission and compensation.
- At what price, under what contract? Chapter 3 shows that the tariff framework stops at 10 MW, leaving large users to negotiate case by case.
- Is there gas, and at what price, for reheating and later for making iron? Chapters 6 and 7 show that the gas balance changed fundamentally in July 2026.
The answers matter beyond one plant. Cameroon’s industrial strategy, the Stratégie Nationale de Développement 2020-2030 (SND30), names mining, metallurgy and steel among its priority sub-sectors [S26]. An energy framework that works for an electric steelworks would also work for the other large loads the Kribi industrial-port zone aims to attract.
Sources cited in this chapter
Bracketed markers refer to these sources; the full list is in the annex. Full list of sources
- S31Energy use in the steel industry (fact sheet). World Steel Association (copy hosted by the Australian Steel Institute), 2016.steel.org.au/getattachment/bfc722b0-1320-4d04-84df-30bdd500aa5b/fact_e…
- S01Rapport d’activités 2025 de l’ARSEL. ARSEL (electricity regulator), 7 Sep 2026.arsel-cm.org/wp-content/uploads/2026/09/Rapport-ARSEL-2025.pdf
- S32Cameroun: le groupe Prometal décroche 26 milliards FCFA auprès d’Afreximbank…. Sikafinance, 30 Sep 2026.sikafinance.com/marches/cameroun-le-groupe-prometal-decroche-26-millia…
- S33Cameroun: Prometal décroche 26,2 milliards FCFA d’Afreximbank. Camer.be, 1 Oct 2026.camer.be/actualites/economie/cameroun-prometal-decroche-262-milliards-…
- S11UN Comtrade public API, Cameroon (reporter 120), HS 72/73 and 6-digit lines, 2019-2023. UN Statistics Division.comtradeapi.un.org/public/v1/preview/C/A/HS?reporterCode=120&period=20…
- S05Données pétrolières 2025. SNH, posted Jun 2026.snh.cm/wp-content/uploads/2026/06/Donnees-petrolieres-2025.pdf
- S16Le navire usine quitte le Cameroun, le gaz s’arrête. Camer.be, 9 Jul 2026.camer.be/93911/12:1/le-navire-usine-quitte-le-cameroun-le-gaz-sarrete-…
- S34Sustainability Indicators 2025 report. worldsteel, Nov 2025 (upd. Feb 2026).worldsteel.org/zh-hans/wider-sustainability/sustainability-indicators/…
- S35Iron and Steel Technology Roadmap. IEA, Oct 2020.iea.blob.core.windows.net/assets/eb0c8ec1-3665-4959-97d0-187ceca189a8/…
- S36Environmental, Health, and Safety Guidelines for Integrated Steel Mills. IFC / World Bank Group, 30 Apr 2007.ifc.org/content/dam/ifc/doc/2000/2007-integrated-steel-mills-ehs-guide…
- S37Best Available Techniques Reference Document, Iron and Steel (EUR 25521). EC JRC, 2013.bureau-industrial-transformation.jrc.ec.europa.eu/sites/default/files/…
- S38Enhanced EAF steelmaking through continuous charging (Consteel). EC ICIT, n.d., accessed Oct 2026.innovation-centre-for-industrial-transformation.ec.europa.eu/innovativ…
- S39ENERGIRON technology (DRI-EAF with natural gas or H₂). EC ICIT, ref. 12 Feb 2026.innovation-centre-for-industrial-transformation.ec.europa.eu/innovativ…
- S07Cameroon Steel reference configuration RC-1 (planning estimate), edition 10 October 2026 (RC-1.1): phases, benchmarks with ranges, indicative balances and schedule. Cameroon Steel, 10 Oct 2026.Cited by title and date
- S40Commission Implementing Decision (EU) 2022/2110, BAT conclusions, ferrous metals processing. European Commission (OJ L 284), 11 Oct 2022.eur-lex.europa.eu/legal-content/EN/TXT/PDF/?uri=CELEX:32022D2110
- S41Suez Steel sets new benchmark in energy consumption for DRI production. Danieli, 16 Apr 2026.danieli.com/en/news-media/news/suez-steel-sets-new-benchmark-energy-co…
- S03Tableaux tarifaires, Décision ARSEL N°00000427 (MT 2023-2025). ARSEL, uploaded Jan 2026.arsel-cm.org/wp-content/uploads/2026/01/TABLEAUX-TARIFAIRES-decision-M…
- S04Décision fixant le montant de la RMA ENEO au titre de l’exercice 2025 (réajustée). ARSEL, 19 Dec 2025.arsel-cm.org/wp-content/uploads/2026/01/Decision-fixant-le-Montant-de-…
- S09Weekly steel prices (archive 40468). Arab Iron & Steel Union (AISU), 3 Oct 2026.aisusteel.org/en/archives/40468
- S42Prometal, Acero Metal, Aciéries du Cameroun… qui est le plus gros consommateur d’électricité de la métallurgie camerounaise. EcoMatin, 15 Jul 2026.ecomatin.net/prometal-acero-metal-acieries-du-cameroun-qui-est-le-plus…
- S43Matériaux de construction: l’offensive locale. Cameroon Tribune, 24 Apr 2023.cameroon-tribune.cm/article.html/56766/en.html/details_2
- S44Hausse des tarifs d’électricité: l’ARSEL minimise l’impact sur les entreprises. EcoMatin, 6 Jan 2023.ecomatin.net/hausse-des-tarifs-delectricite-larsel-minimise-limpact-de…
- S45Électricité: les aciéries s’insurgent contre la hausse des tarifs. EcoMatin, 10 Jan 2023.ecomatin.net/electricite-les-acieries-sinsurgent-contre-la-hausse-des-…
- S10Carbon intensity of electricity generation (Ember data). Our World in Data, Dataset accessed Oct 2026.ourworldindata.org/grapher/carbon-intensity-electricity
- S30Carbon Border Adjustment Mechanism. European Commission (DG TAXUD), n.d., accessed Oct 2026.taxation-customs.ec.europa.eu/carbon-border-adjustment-mechanism_en
- S46Regulation (EU) 2023/956 (CBAM), Annex I. EUR-Lex (OJ L 130), 16 May 2023.eur-lex.europa.eu/legal-content/EN/TXT/PDF/?uri=CELEX:32023R0956
- S47Price of CBAM certificates. European Commission, 5 Oct 2026 (latest).taxation-customs.ec.europa.eu/carbon-border-adjustment-mechanism/price…
- S26Stratégie Nationale de Développement 2020-2030 (SND30). Republic of Cameroon / MINEPAT (hosted by FAOLEX), 2020.faolex.fao.org/docs/pdf/cmr211554.pdf
Cite this chapter
Cameroon Steel (2026). Cameroon’s hydro grid can power low-carbon steel if large users get firm supply, clear tariffs and gas. White paper 05, chapter 1: Energy decides the cost and the carbon of electric steel. CS-WP-05. https://www.cameroon-steel.com/en/library/energy-for-industry/energy-in-steel-economics/
Source