White paper 05 · Chapter 8
Hydro is Cameroon’s renewable advantage for steel; solar and storage help at the margin but cannot firm an arc furnace
Cameroon’s grid already emits about 226 g CO₂e per kWh, half the world average, because it runs on hydro, and its undeveloped hydro potential is about 115 TWh a year. That, rather than solar, is the country’s renewable asset for heavy industry. A solar plant at Kribi would produce about 1,335 kWh per kWp a year, a 15% capacity factor with a mid-year trough: a 50 MWp array would supply about a fifth of a first-phase steelworks’ electricity, but almost none of its night-time or peak demand. The best renewable strategy for an electric steelworks is a long-term hydro-backed supply contract, with solar where it lowers cost and storage used for resilience and power quality rather than bulk energy.
In this chapter (9)
- 8.1 Cameroon’s grid is already a low-carbon asset
- 8.2 The carbon value of clean power depends on who is counting
- 8.3 Reporting clean power: two methods, two answers
- 8.4 A solar plant at Kribi would yield about 1,335 kWh per kWp a year
- 8.5 Solar covers the middle of the day, not the furnace’s night shift
- 8.6 Batteries are for resilience and power quality, not bulk energy
- 8.7 Hydro is the renewable that matters, and a large user can help build it
- 8.8 What a hydro-backed supply contract would contain
- 8.9 Hydrogen-based iron is a long-term option tied to new hydro
8.1 Cameroon’s grid is already a low-carbon asset
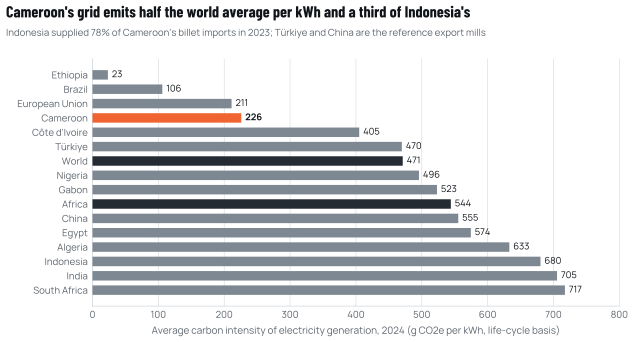
Figure 8.1 compares the average carbon intensity of electricity generation in 2024 across Cameroon, its neighbours and the countries that supply steel to Central Africa or compete with it.
Source: Our World in Data, carbon intensity of electricity generation, Ember data, accessed 10 October 2026 [S10]; billet import origins from UN Comtrade [S11].
At about 226 g CO₂e/kWh, Cameroon’s grid was cleaner in 2024 than the world average (about 471 g), the African average (about 544 g), and the grids of the main steel exporters to the region: China (about 555 g), Türkiye (about 470 g), India (about 705 g) and Indonesia (about 680 g), which supplied 78% of Cameroon’s billet imports in 2023 [S10][S11]. Only a few countries with large hydro fleets, such as Ethiopia and Brazil, do markedly better.
For a steelworks using about 0.96 MWh per tonne of product, as RC-1 Phase 1 would at its planning value [S07], the indirect (Scope 2) emissions at each of these grid intensities would be (derived; about 4% higher at the upper planning value of 1.0 MWh/t):
- about 0.22 t CO₂ per tonne in Cameroon;
- about 0.45 t at the world average;
- about 0.65 t in Indonesia.
Two caveats apply. First, the 226 g figure is an average on a life-cycle basis, which includes the emissions of building and operating hydro plants. Using only combustion emissions and the regulator’s 2025 generation data, the operational intensity would be much lower, about 74 g/kWh in 2025 (an estimate, derived in White paper 06, Annex A, by applying the emission rate of gas and oil generation implied by the 2024 data to the 2025 generation mix). Second, lenders and carbon accountants often use a combined-margin factor, which gives more weight to the thermal plants that run at the margin and to new capacity; the harmonised factor for Cameroon could not be retrieved for this paper (Chapter 11). The planning range used by Cameroon Steel is 200 to 300 g/kWh, centred on 226 [S07].
8.2 The carbon value of clean power depends on who is counting
The carbon advantage of Cameroon’s grid is real, but its commercial value depends on the rule that is applied.
At the EU border, under CBAM as it stands, electricity’s emissions do not count for steel. The CBAM regulation lists iron and steel among the goods for which only direct emissions are taken into account [S46]. For an electric steelworks, the direct emissions are small (electrodes, charge carbon, lime and any gas burned on site), so the CBAM charge on its exports would be low whatever the grid. The grid matters for CBAM chiefly through the precursors: DRI made with gas carries its own direct emissions.
For customers, investors and standards, Scope 2 counts in full. Buyers who report their own supply-chain (Scope 3) emissions, and the low-emission steel standards now emerging, look at the whole footprint. The IEA’s threshold for "near-zero emission" crude steel falls from 0.40 t CO₂e per tonne for steel made entirely from ore to 0.05 t for steel made entirely from scrap [S20]. For a charge with about 70% scrap, as planned for RC-1 Phase 1 [S07], the threshold would be about 0.155 t (derived). At the grid average of 226 g/kWh, Scope 2 alone (about 0.22 t) would exceed that threshold; with a contracted hydro supply reported under the market-based method, Scope 2 could approach zero and the plant could approach the near-zero band.
That is the central renewable insight for an electric steelworks in Cameroon: a dedicated hydro contract is worth more than the grid average, because it lets the plant claim the hydro attribute that the grid average dilutes. It is also the reason why the wheeling and large-user rules of Chapter 3 matter for climate policy as well as for price.
8.3 Reporting clean power: two methods, two answers
Companies report the emissions of the electricity they buy in two ways. The location-based method applies the average emission factor of the grid where the electricity is consumed: for a plant at Kribi, about 226 g CO₂e/kWh on the 2024 average [S10]. The market-based method applies the emission factor of the electricity the company has contracted, provided the contract carries a credible claim to the attributes of specific generation, such as a certificate of origin from a hydro plant.
On the location-based method, every user of Cameroon’s grid shares the same average, and a steelworks cannot do better than the grid. On the market-based method, a steelworks that contracts hydro output can report close to zero Scope 2 emissions, while the grid average for other users rises correspondingly. The second method is what most buyers of low-emission steel will look for, but it requires two things Cameroon does not yet have: the legal ability to contract with a specific producer, through wheeling or a dedicated utility product, and a registry that issues and cancels certificates so that the same hydro output is not claimed twice. Both are part of the recommendations in Chapter 10.
8.4 A solar plant at Kribi would yield about 1,335 kWh per kWp a year
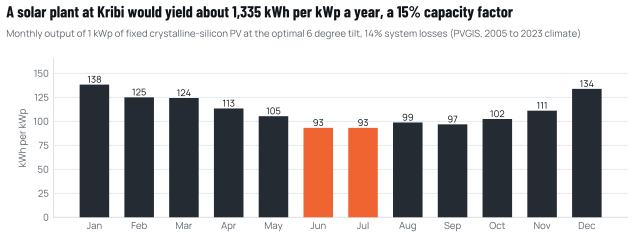
The European Commission’s Joint Research Centre publishes a validated solar model for Africa, PVGIS, based on satellite radiation data. For Kribi, a fixed crystalline-silicon array at its optimal tilt of 6 degrees, with 14% system losses, would produce about 1,335 kWh per kWp a year, a capacity factor of about 15% [S19]. Output peaks from December to February, at about 134 to 138 kWh per kWp a month, and falls to about 93 kWh in June and July, when cloud cover over the coast is heaviest (Figure 8.2).
Source: JRC PVGIS v5.3, radiation database PVGIS-SARAH3, climate 2005 to 2023, Kribi (2.94 N, 9.91 E), accessed 10 October 2026 [S19].
Solar is now cheap to build. IRENA reports that new utility-scale solar commissioned worldwide in 2024 had a global weighted average levelised cost of US$0.043/kWh, against US$0.034 for onshore wind and US$0.057 for new hydropower [S104]. At the planning rate of 600 FCFA per US dollar, US$0.043/kWh is about 26 FCFA/kWh (derived), below the MV band price and far below the cost-reflective average of Chapter 3. Costs in Cameroon would be higher than the global average because of financing costs, logistics and the lower yield, but solar energy would still compete with grid energy on a per-kWh basis.
Cameroon’s solar output was 67.2 GWh in 2025, 0.8% of generation [S01], so the resource is barely used.
8.5 Solar covers the middle of the day, not the furnace’s night shift
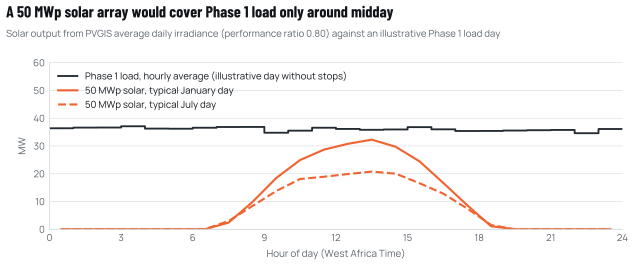
The limitation of solar for a steelworks is its shape, not its cost. Figure 8.3 sets the output of a 50 MWp array against an illustrative day of Phase 1 load.
Source: JRC PVGIS v5.3 daily profiles [S19]; illustrative Phase 1 load from RC-1 benchmarks [S07].
A 50 MWp array would produce about 67 GWh a year, about 22% to 23% of Phase 1’s 289 to 302 GWh (derived). On a January day it would meet most of the load around midday; on a July day, at most about 20 MW; and at night, nothing. It would therefore reduce the energy bought from the grid but not the firm capacity the plant must contract, and it would not reduce the maximum demand on which capacity charges are based, because the furnace peaks at any hour.
Solar’s contribution can be raised in three ways, none of them a substitute for firm supply:
- Rooftops and land on site. Mill halls and stores have large roofs, and Phase 1’s roofs and yards could host several MWp. On-site solar avoids wheeling and transmission charges, but its size is limited by the area available.
- Off-site solar with wheeling. A larger plant elsewhere on the southern grid could supply the steelworks through SONATREL’s network under the independent-producer provisions of Law No. 2011/022 [S52], if wheeling and balancing rules are in place (Chapter 3).
- Scheduling flexible loads. Some auxiliary loads, such as water treatment and part of the oxygen production with liquid storage, can be shifted to the middle of the day.
8.6 Batteries are for resilience and power quality, not bulk energy
Battery storage has become much cheaper: IRENA reports that the cost of battery storage projects fell by 93% between 2010 and 2024, to about US$192 per kWh [S104]. For a steelworks, that opens four uses, in decreasing order of value:
- Ride-through for essential loads. A battery can carry cooling water, cranes and fume extraction through short interruptions while standby generators start.
- Fast frequency and voltage support. A battery inverter can respond within milliseconds, helping the grid absorb the furnace’s load steps and potentially contributing to flicker mitigation when its converter is designed to act like a STATCOM.
- Peak shaving. By discharging during the highest 15-minute periods, a battery can reduce the billed maximum demand under a capacity-plus-energy tariff (Figure 3.2).
- Shifting solar energy into the evening. This is the least economic use for an arc furnace. Carrying Phase 1’s average load of about 36 to 38 MW through a 12-hour night would require more than 400 MWh of storage (derived), many times the capacity needed for the first three uses.
Table 8.1 Renewable and storage options for an electric steelworks at Kribi
| Option | Energy contribution | Firm capacity | Carbon effect | Price reference | Preconditions |
|---|---|---|---|---|---|
| Grid supply (average) | All needs | As contracted | About 226 g/kWh average (2024) | Chapter 3 benchmarks | Large-user contract |
| Contracted hydro supply (existing or new plants) | Large share of needs | Seasonal; needs firming | Market-based Scope 2 near zero | Memve’ele purchase price 43.93 FCFA/kWh (wholesale) | Wheeling or utility green contract; firming rules |
| On-site rooftop and ground solar | A few per cent to about a fifth | None | Reduces grid energy | IRENA global average US$0.043/kWh (2024) | Roof and land area |
| Off-site solar with wheeling | Up to about a quarter in daytime | None | Reduces grid energy | As above plus transmission (about 2.7 FCFA/kWh) | Wheeling and balancing rules |
| Battery storage | Small | Short duration only | Indirect | IRENA project cost about US$192/kWh (2024) | Clear role: ride-through, support, peak shaving |
| Gas engines (comparison) | Any share | High | About 0.5 t CO₂/MWh at the Kribi plant’s 2025 efficiency (derived) | Fuel about 17 to 30 FCFA/kWh at 2025 gas prices (derived) | Gas allocation |
Source: [S10][S01][S104][S19][S53][S05]; Cameroon Steel analysis. Gas-engine figures derived from the Kribi plant’s 2025 gas use and output and the IPCC default emission factor for natural gas (Annex A).
8.7 Hydro is the renewable that matters, and a large user can help build it
Cameroon’s hydro potential, about 115,000 GWh a year with only about 4% developed [S66], is the foundation of a low-carbon industrial strategy. The near-term projects on the southern grid are Kikot-Mbebe, 500 MW, with commissioning expected between 2031 and 2033 [S68], and the proposed Grand Eweng, of 1,000 MW in a first phase and up to 1,800 MW [S69]. Recent experience shows both the value and the variability of hydro: Nachtigal delivered 28% below plan in 2025 because of river flows, while Memve’ele delivered 129% above plan [S01].
A large industrial customer can help finance new hydro. A long-term offtake contract from a creditworthy industrial buyer, paid in part in hard-currency-linked prices if the buyer exports, improves the bankability of a new plant compared with sales to a financially stretched utility alone. In return, the industrial buyer obtains a long-term price and a renewable attribute it can report. For this to work, the contract must deal with seasonality. A single-furnace plant that needs most of the year’s hours to reach its nameplate cannot absorb sustained dry-season curtailment, since each lost hour costs about one heat of about 40 t (Chapter 9). The hydro supply must therefore be firmed with gas-fired capacity, at a price, while the plant schedules its melting around the daily peak.
8.8 What a hydro-backed supply contract would contain
A long-term hydro-backed contract for an electric steelworks would differ from an ordinary supply contract in five ways:
- Volume shape. Hydro output is seasonal. The contract would specify a baseload volume for the wet season and a reduced, firmed volume for the dry season, rather than a flat profile all year.
- Firming. The difference between the steelworks’ load and the hydro volume in dry periods would be covered by firm gas-fired capacity, priced separately. The plant’s contribution is to schedule its melting away from the daily peak, not to accept sustained curtailment.
- Price and indexation. A long-term price linked to the cost of the hydro plant, with transparent indexation, would give the plant a cost it can plan around and the hydro project a revenue it can finance.
- Attributes. Certificates of origin, issued and cancelled through a registry, would let the steelworks report the hydro supply under the market-based method and let the hydro project prove its output was not sold twice.
- Transmission and balancing. A wheeling arrangement with the transmission company, and a balancing rule for the hours when supply and demand diverge.
None of these elements is technically unusual. What Cameroon lacks is the published framework within which they can be negotiated, which is why the policy recommendations of Chapter 10 come before any specific contract.
8.9 Hydrogen-based iron is a long-term option tied to new hydro
The longest-term link between renewables and steel is hydrogen. Hydrogen-based direct reduction needs about 54 kg of hydrogen per tonne of DRI, equivalent to roughly 2.4 to 2.8 MWh of electricity per tonne for electrolysis alone (derived from [S93][S35]). A 1 Mtpa hydrogen-based module would therefore need 2.4 to 2.8 TWh a year, about a third of Cameroon’s entire 2025 generation. That is achievable only with new hydro on the scale of the large Sanaga projects.
Africa has a first precedent. In Namibia, the HyIron Oshivela project, inaugurated on 11 April 2025, combines 25 MW of solar, a 13.4 MW battery and a 12 MW electrolyser to make hydrogen-based iron at pilot scale, with plans to grow in stages [S105][S106]. Its scale is a reminder of how far there is to go: Cameroon’s opportunity is to keep the hydrogen route open, by choosing gas-based reduction plants that can accept hydrogen blending (Chapter 7), and by planning large hydro with industrial offtake in mind.
Sources cited in this chapter
Bracketed markers refer to these sources; the full list is in the annex. Full list of sources
- S10Carbon intensity of electricity generation (Ember data). Our World in Data, Dataset accessed Oct 2026.ourworldindata.org/grapher/carbon-intensity-electricity
- S11UN Comtrade public API, Cameroon (reporter 120), HS 72/73 and 6-digit lines, 2019-2023. UN Statistics Division.comtradeapi.un.org/public/v1/preview/C/A/HS?reporterCode=120&period=20…
- S07Cameroon Steel reference configuration RC-1 (planning estimate), edition 10 October 2026 (RC-1.1): phases, benchmarks with ranges, indicative balances and schedule. Cameroon Steel, 10 Oct 2026.Cited by title and date
- S46Regulation (EU) 2023/956 (CBAM), Annex I. EUR-Lex (OJ L 130), 16 May 2023.eur-lex.europa.eu/legal-content/EN/TXT/PDF/?uri=CELEX:32023R0956
- S20Achieving Net Zero Heavy Industry Sectors in G7 Members. IEA, 19 May 2022.iea.blob.core.windows.net/assets/c4d96342-f626-4aea-8dac-df1d1e567135/…
- S19PVGIS v5.3 web services (PVcalc, DRcalc), Kribi 2.94 N 9.91 E, PVGIS-SARAH3 2005 to 2023. European Commission, Joint Research Centre.re.jrc.ec.europa.eu/api/v5_3/
- S104Renewable Power Generation Costs in 2024. International Renewable Energy Agency (IRENA), July 2025.irena.org/Publications/2025/Jun/Renewable-Power-Generation-Costs-in-20…
- S01Rapport d’activités 2025 de l’ARSEL. ARSEL (electricity regulator), 7 Sep 2026.arsel-cm.org/wp-content/uploads/2026/09/Rapport-ARSEL-2025.pdf
- S52Reforming Cameroon’s power sector (on Law No. 2011/022 of 14 December 2011). IFLR (Orrick Herrington & Sutcliffe; ENEO), 3 Jun 2016.iflr.com/article/2gjw2n5ocpr2orkj9qxcr/iflr1000/reforming-cameroons-po…
- S53Tarif transport et GRT (Décision 0000017D). ARSEL, 17 Jan 2025.arsel-cm.org/wp-content/uploads/2026/01/TARIF-TRANSPORT-ET-GRT-1.pdf
- S05Données pétrolières 2025. SNH, posted Jun 2026.snh.cm/wp-content/uploads/2026/06/Donnees-petrolieres-2025.pdf
- S66Cameroon: Energy (Country Commercial Guide). US International Trade Administration, 13 Apr 2026.trade.gov/country-commercial-guides/cameroon-energy
- S68Government, EDF push to deliver hydro promises as Cameroon moves to diversify energy sources. Business in Cameroon, 4 Dec 2025.businessincameroon.com/energy/0412-15443-government-edf-push-to-delive…
- S69Cameroon plans to build 1 GW Grand Eweng hydropower project. Enerdata, Jul 2019.enerdata.net/publications/daily-energy-news/cameroon-plans-build-1-gw-…
- S93Hydrogen uses in ironmaking (V. Chevrier, Midrex). US DOE H2@Scale, 1 Aug 2018.energy.gov/sites/prod/files/2018/08/f54/fcto-h2-scale-kickoff-2018-8-c…
- S35Iron and Steel Technology Roadmap. IEA, Oct 2020.iea.blob.core.windows.net/assets/eb0c8ec1-3665-4959-97d0-187ceca189a8/…
- S105Global Gateway: Namibia becomes pioneer for Africa’s green transition. European Commission (INTPA), 11 Apr 2025.international-partnerships.ec.europa.eu/news-and-events/news/global-ga…
- S106Namibia opens renewables-powered green iron plant. Energize, 15 Apr 2025.energize.co.za/article/namibia-opens-renewables-powered-green-iron-pla…
Cite this chapter
Cameroon Steel (2026). Cameroon’s hydro grid can power low-carbon steel if large users get firm supply, clear tariffs and gas. White paper 05, chapter 8: Hydro is Cameroon’s renewable advantage for steel; solar and storage help at the margin but cannot firm an arc furnace. CS-WP-05. https://www.cameroon-steel.com/en/library/energy-for-industry/renewables-and-storage/
Source