White paper 10 · Chapter 5
A mill proves quality with statistics and traceability, not with single tests
A certified rebar mill demonstrates conformity in three ways: it measures the chemistry of every heat, it tests every lot mechanically and dimensionally by standard methods, and it evaluates its results statistically over time so that characteristic values are proven rather than assumed. Traceability from heat number to bundle tag ties each certificate to real steel. A single test report, which is what most buyers see, proves very little on its own; a stable process with a documented history proves a great deal.
In this chapter (8)
- 5.1 Chemistry is measured on every heat, before it is cast
- 5.2 Mechanical and dimensional tests follow defined methods
- 5.3 Statistics turn a set of tests into a guarantee
- 5.4 Statistical process control catches drift while every bar still passes
- 5.5 Traceability ties every certificate to real steel
- 5.6 Calibration, retained samples and complaints close the loop
- 5.7 Certification adds an independent check on the mill’s own testing
- 5.8 A minimum laboratory for a rebar mill is modest; competence is the larger investment
5.1 Chemistry is measured on every heat, before it is cast
The first test is the cheapest and the most decisive. Before a heat is released from the ladle furnace to the caster, a sample is taken and analysed by spark optical emission spectrometry, the standard method for carbon and low-alloy steels [S77]. Within minutes the melt shop knows the carbon, manganese, silicon, phosphorus, sulphur, copper and other residuals, and can trim the heat with alloy additions if it is off target. Nitrogen, which governs strain-ageing and rebend performance, requires an instrument capable of measuring it or a separate analyser.
The final ladle analysis becomes the cast analysis printed on the inspection certificate, together with the carbon equivalent calculated from it. Product standards also define a product analysis, taken on the finished bar, with slightly wider limits to allow for segregation [S38]; certified mills check it periodically, and buyers or surveillance bodies can use it to verify a certificate. A spectrometer is only as good as its calibration: it must be checked daily against certified reference materials and its results compared periodically with an external laboratory.
5.2 Mechanical and dimensional tests follow defined methods
Reinforcing bars have their own test standard, EN ISO 15630-1, which specifies how to perform the tensile, bend and rebend tests, how to measure the total elongation at maximum force (Agt), how to determine the mass per metre and how to measure rib geometry and calculate the relative rib area [S44]. The tensile test itself follows the general method for metallic materials, ISO 6892-1 [S45]. ASTM bars are tested to the methods referenced in their own specifications [S40].
The tensile test gives the yield strength, the tensile strength, their ratio, Agt and the elongation after fracture. The bend or rebend test checks for cracks after bending round a mandrel. The geometry check confirms rib height, spacing, inclination and gaps. The mass test, made by weighing a straight length measured to the millimetre, confirms the cross-section. The table below shows a typical factory production control plan. Frequencies are set by each product standard and certification scheme, and the plan shown is indicative.
Table 5.1 An indicative factory production control plan for reinforcing bar
| Control | Method | Indicative frequency | Recorded on the certificate | Typical acceptance basis |
|---|---|---|---|---|
| Cast chemistry (C, Mn, Si, P, S, N, Cu, Cr, Ni, Mo, V) and Ceq | Spark optical emission spectrometry; nitrogen by suitable method | Every heat, before casting | Yes | Cast limits of the product standard |
| Product chemistry | Same, on finished bar | Periodically, and on demand | On request | Product limits (slightly wider) |
| Yield and tensile strength, Rm/Re, Agt, elongation after fracture | Tensile test, ISO 6892-1 and EN ISO 15630-1 | Several tests per heat and per diameter | Yes, per heat | Characteristic values (statistical) and individual minima |
| Bend or rebend | EN ISO 15630-1 | Per heat or per lot | Yes | No cracks visible to the naked eye |
| Rib geometry and fR | Measurement of rib height, spacing, gaps; fR calculation | Each roll change and each shift | On request | Minimum fR and geometry ranges |
| Mass per metre and diameter | Weighing of a measured length | Each lot and each shift | Yes | Tolerance of the standard |
| Surface condition and marking | Visual inspection on the cooling bed | Continuous | No | No laps, seams, cracks; legible mill mark |
| Fatigue (where certified) | Axial load test, 2 million cycles | Periodic, by the certification body | Certificate option | Stress range of the scheme, e.g. 150 MPa |
Source: methods from [S44][S45]; fatigue parameters from the AFCAB scheme [S31]. Frequencies are indicative assumptions for illustration; the governing standard and certification scheme set the actual plan.
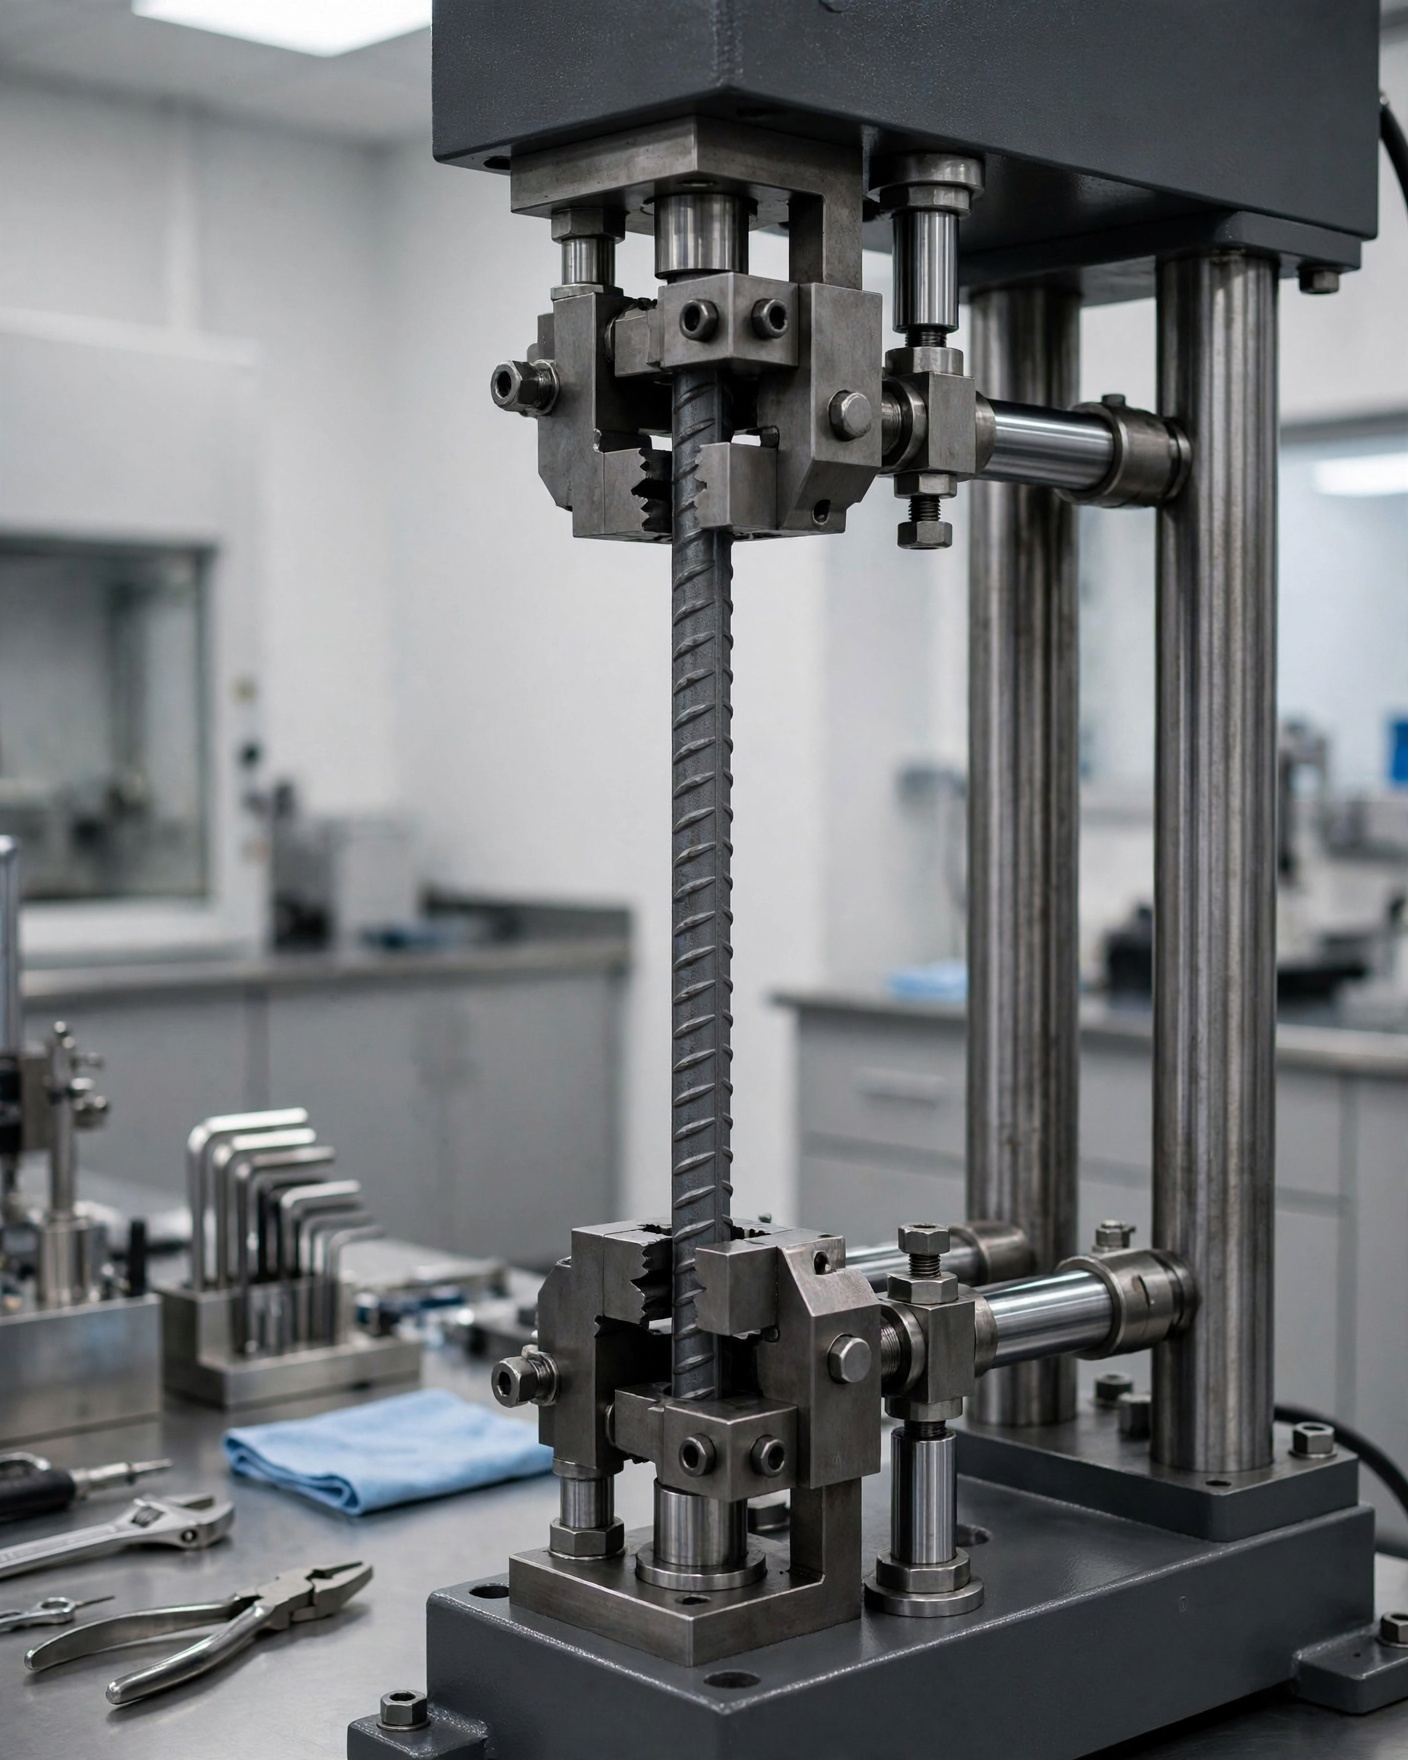
Two practical points matter in a laboratory serving a rebar mill. First, the test machine and extensometer must be calibrated and the laboratory’s competence demonstrated, ideally by accreditation to ISO/IEC 17025 [S55]; a machine that reads 3% high turns a weak heat into a passing one. Second, Agt must be measured properly. Because Agt is the strain at maximum force, it is easily mis-read from a chart or confused with the elongation after fracture. EN ISO 15630-1 sets out how to determine it, either with an extensometer or by a manual method on marks made before the test [S44]. A certificate that reports elongation after fracture but no Agt cannot demonstrate a Eurocode ductility class.
Testing is also where a mill’s own staff learn what the process is doing. A tensile curve with an unusually short yield plateau, an Agt that drifts down over a week, or a rebend specimen that shows fine cracks at the edge of the ribs are early signals of a change in chemistry, quench or rolling that a well-run mill investigates before any result falls outside the standard.
5.3 Statistics turn a set of tests into a guarantee
A characteristic yield strength of 500 MPa is a statement about the whole production: at most 5% of bars may fall below it. No mill can test every bar, so the guarantee must be inferred from samples. The method used by product standards and certification schemes is a statistical tolerance limit: the mean of n test results minus k times their standard deviation must be at least the characteristic value, where k depends on the number of results and on the confidence required [S57]. For a 95% coverage at 90% confidence, k is about 2.33 for 15 results, 2.08 for 30 and 1.97 for 50 (derived; Annex A).
The consequence is that a mill with more scatter must aim higher. With a standard deviation of 30 MPa, typical of well-controlled production [S29], and 30 results, the mean yield must be at least 500 + 2.08 × 30 = 562 MPa (derived). This is why the mean yield of a good B500 mill sits around 550 to 580 MPa, and why the probabilistic model used by structural reliability analysts sets the mean at the nominal value plus two standard deviations [S29]. A mill that cannot hold its scatter near 30 MPa must either raise its mean, at a cost in alloy or quench intensity, or accept that more of its bars fall below 500 MPa.
The same logic applies to Agt and Rm/Re, which also have characteristic values in the European family [S31]. Individual minimum values, such as 475 MPa for yield and 4% for Agt under the French B500B scheme [S31], act as a safety net that no single test may breach.
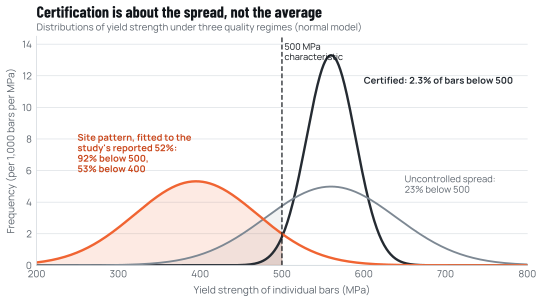
Source: Cameroon Steel calculation with normal distributions: σ = 30 MPa from [S29]; coefficient of variation of 14% from [S28]; site pattern fitted to the 52% share below 400 MPa reported in [S19] (24 bars; the study’s own counts give 46%) with an assumed σ of 75 MPa (illustrative). Annex A.
Field evidence shows how far uncontrolled supply can depart from this. A study of 329 bars bought on the Ethiopian market between 2015 and 2020, local and imported, found coefficients of variation of yield strength of 14.5% and 14.2% in two lots, two to three times the scatter of controlled production, and found that most samples fell short of the tensile-to-yield ratio of 1.25 that the authors used as a reference for ductile behaviour [S28]. In Cameroon, a study of bars sampled on active building sites in Bamenda, Douala, Maroua and Yaoundé found that 11 of 24 bars (46%; the study itself reports 52%) had yield stresses below 400 MPa, that the largest deviation in yield strength was 22.5%, and that bars without a marked manufacturer’s name failed all the tests [S19]. The figure shows what these numbers imply: the problem is not that the average bar is a little weak, but that a large share of the population is far below grade.
5.4 Statistical process control catches drift while every bar still passes
Release testing tells a mill whether a lot conforms. Statistical process control (SPC) tells it whether the process is changing, and does so early enough to correct it. The tool is the control chart: each heat’s mean yield, Agt, mass deviation or rib height is plotted against control limits calculated from the process’s own recent history, typically at three standard deviations either side of the mean. Run rules flag non-random patterns, such as eight successive heats below the mean, even when every individual result is still within specification.
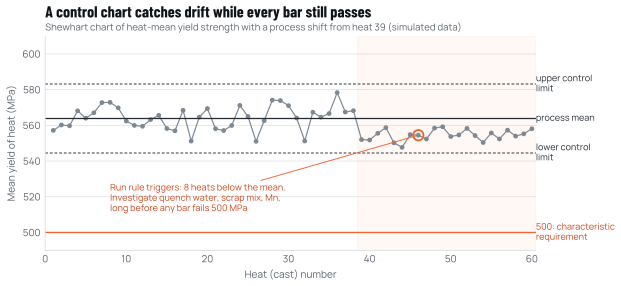
Source: Cameroon Steel simulation (normal random data, seed recorded in the chart data file). Illustrative of the method only.
In a QST mill, the usual causes of drift are well known: a change in the scrap mix that lowers manganese or raises residuals, worn or partly blocked quench nozzles, a change in finishing temperature or rolling speed, and the temperature of the cooling water. The last point matters in a coastal tropical climate, where process water runs warm for much of the year and the quench must be compensated by flow or pressure to deliver the same cooling. Rib height drifts as finishing rolls wear, which is why geometry is checked at each roll change. A mill that charts these variables, and links each to the heat number, can explain and correct a downward trend before it produces a failed test or a complaint.
5.5 Traceability ties every certificate to real steel
A test result has value only if it can be linked to the steel it describes. Traceability in a rebar mill rests on four links:
- The heat number, assigned at the furnace, stamped or painted on every billet, and carried through reheating and rolling.
- The rolled-in mark, a pattern of ribs or symbols that identifies the producing mill (and, in the European family, the country) on every metre of bar [S31][S34].
- The bundle tag, which repeats the heat number and gives the grade, standard, diameter, length, mass, date and certification marks [S31][S32].
- The inspection document, which reports the results for the heats delivered.
The European standard on inspection documents, EN 10204, distinguishes a test report type 2.2, which gives results of non-specific inspection on similar production, from an inspection certificate type 3.1, which gives results of specific inspection on the products supplied and is validated by the manufacturer’s authorised inspection representative, independent of the manufacturing department, and a type 3.2, which is also validated by the purchaser’s representative or a third-party inspector [S46]. For structural reinforcement, a type 3.1 certificate tied to heat numbers is the appropriate minimum, and type 3.2 can be required for critical works. The chapter on specification shows how to read one.
Traceability also makes recall possible. When the Cameroonian authorities ordered the recall of a non-conforming grade in October 2024 [S04][S05], the effectiveness of the recall depended on being able to identify the bars in the market. Rolled-in marks and tags are what make that identification possible for merchants and site engineers.
5.6 Calibration, retained samples and complaints close the loop
Three routines distinguish a laboratory that produces reliable results from one that merely produces numbers. Calibration and verification: the force measurement of the testing machine and the extensometer are calibrated at defined intervals by an accredited calibration service and verified between calibrations with reference specimens. Proficiency testing: the laboratory periodically tests specimens that other laboratories also test and compares the results, which exposes systematic bias that internal checks cannot reveal; participation in such comparisons is an expectation of ISO/IEC 17025 [S55]. Retained samples: a short length of bar from each heat is kept for a defined period, so that a later complaint can be investigated against the original material.
The last element is complaint handling. A well-run mill records every complaint from merchants and sites, investigates it against its heat records and retained samples, and reports the outcome and the corrective action. Complaints are information: a cluster of reports of bars cracking at bends, for example, may point to a nitrogen or quench problem during a specific period that release testing did not catch. Handled openly, complaints build the trust between producers, merchants and engineers on which a quality market depends; ignored, they turn into the kind of public dispute about quality that Cameroon saw in 2023 [S09][S10].
5.7 Certification adds an independent check on the mill’s own testing
Everything described so far is the mill testing itself. Product certification adds an independent party. Under schemes such as AFCAB in France or CARES in the United Kingdom, the certification body assesses the mill’s factory production control before granting the mark, audits it periodically, takes its own samples for independent testing, reviews the long-term statistics of the mill’s results and can suspend or withdraw the certificate [S31][S33]. The mark on the bundle then tells the buyer that someone other than the seller has checked the evidence.
It is important not to confuse product certification with management-system certification. An ISO 9001 certificate shows that a company operates a documented quality management system [S78]; it does not certify that its bars meet a grade. When a producer in a dispute about bar quality cites ISO 9001, as happened in Cameroon in 2023 [S10], buyers should ask for the product certificate and the inspection certificates for the heats delivered.
5.8 A minimum laboratory for a rebar mill is modest; competence is the larger investment
What does a mill need in order to prove its product? The core equipment of a rebar laboratory is modest by industrial standards:
- An optical emission spectrometer with calibration standards for carbon and low-alloy steel, and a means of measuring nitrogen, close to the melt shop so that each heat can be corrected before casting [S77].
- A universal testing machine large enough for the largest bar produced. A 40 mm bar at the 650 MPa maximum yield of several national versions carries about 820 kN at yield (derived: 1,256.6 mm² × 650 MPa), so a machine of 1,000 kN capacity with grips for ribbed bars covers the full size range.
- An extensometer, or the marking equipment needed to determine Agt by the manual method of EN ISO 15630-1 [S44].
- Bending and rebending equipment with mandrels of the diameters the standards require, and an oven for the artificial ageing step of the rebend test.
- A balance and length measurement for mass per metre, and gauges for rib height and spacing.
- A sample-preparation area with a cut-off saw, and storage for retained samples.
Equipment is the smaller part of the effort; competence is the larger. Trained technicians, documented procedures, calibration, participation in proficiency testing and, in time, accreditation to ISO/IEC 17025 [S55] are what make a laboratory’s numbers trustworthy to a certification body and to buyers. A laboratory established at a mill can also serve the wider market: testing samples for contractors and public authorities is one way in which a producer’s investment in quality can help build the national testing capacity that the chapter on the quality infrastructure found lacking.
Sources cited in this chapter
Bracketed markers refer to these sources; the full list is in the annex. Full list of sources
- S77ASTM E415 Standard test method for analysis of carbon and low-alloy steel by spark atomic emission spectrometry. ASTM International, current edition.store.astm.org
- S38BS 4449:2005+A3:2016 Steel for the reinforcement of concrete. Weldable reinforcing steel. Bar, coil and decoiled product. Specification. British Standards Institution (BSI), 2016.boutique.afnor.org/en-gb/standard/bs-44492005-a32016/steel-for-the-rei…
- S44ISO 15630-1:2019 Steel for the reinforcement and prestressing of concrete, Test methods, Part 1: Reinforcing bars, rods and wire (EN ISO 15630-1). ISO; CEN, 2019.iso.org
- S45ISO 6892-1:2019 Metallic materials, Tensile testing, Part 1: Method of test at room temperature. ISO, 2019.iso.org
- S40ASTM A615/A615M Standard specification for deformed and plain carbon-steel bars for concrete reinforcement. ASTM International, current edition.store.astm.org
- S31Certificat N° B03/176 rév. 16, aciers pour béton armé, NF A 35-080-1 nuance B500B (fiche descriptive and caractéristiques certifiées). Association Française de Certification des Armatures du Béton (AFCAB), AFNOR Certification, 6 Jun 2025.feralpi-stahl.com/sites/default/files/media/certifications/NF%20AFCAB-…
- S55ISO/IEC 17025:2017 General requirements for the competence of testing and calibration laboratories. ISO; IEC, 2017.iso.org
- S57ISO 16269-6:2014 Statistical interpretation of data, Part 6: Determination of statistical tolerance intervals. ISO, 2014.iso.org
- S29Probabilistic Model Code, Part 3: Resistance models, 3.2 Static properties of reinforcing steel. Joint Committee on Structural Safety (JCSS), 2001 edition.jcss-lc.org/publications/jcsspmc/rebar.pdf
- S28Mechanical strength variability of deformed reinforcing steel bars for concrete structures in Ethiopia. Scientific Reports 12, 2600. T. Achamyeleh, H. Çamur, M. A. Savaş, A. Evcil; Nature Portfolio, 2022.doi.org/10.1038/s41598-022-06654-1
- S19Assessment of Deviation in Quality of Steel Reinforcing Bars Used in Some Building Sites in Cameroon. World Journal of Engineering and Technology, 11(4), pp. 917 to 931. P. C. Bame, B. E. Yamb, B. Ndigui; Scientific Research Publishing, 2023.doi.org/10.4236/wjet.2023.114061
- S34Rebar 101 (presentation: ASTM bar specifications, tensile and elongation tables, permissible variation in weight, marking). Concrete Reinforcing Steel Institute (CRSI), hosted by New Jersey Institute of Technology, n.d..web.njit.edu/~washd/cim101/download/notes/CRSI/Rebar101_University%20%…
- S32Technical specification SPF400 rev. 12, Rebars B500 (chemical, mechanical and dimensional requirements under EN 10080 and national standards). Ferriere Nord S.p.A. (Pittini group), 14 Sep 2021.pittini.it/wp-content/uploads/Pittini-Group-Reinforcing-Steel-Bars-B50…
- S46EN 10204:2004 Metallic products, Types of inspection documents. CEN, 2004.standards.cencenelec.eu
- S04Cameroun: pour non-respect des normes, le fer à béton de la société […] retiré du marché (name of the producer omitted here). EcoMatin, 21 Oct 2024.Cited by title and date
- S05Cameroon revokes […] compliance certificate for rebar, orders recall of products (name of the producer omitted here). Business in Cameroon, 17 Oct 2024.Cited by title and date
- S09Métallurgie: les industriels du secteur dénoncent la présence du fer à béton contrefait sur le marché camerounais. EcoMatin, 22 Jun 2023.ecomatin.net/metallurgie-les-industriels-du-secteur-denoncent-la-prese…
- S10Interdiction des importations du fer à béton: les consommateurs dénoncent la mauvaise qualité de la production locale. EcoMatin, 13 Apr 2023.ecomatin.net/interdiction-des-importations-du-fer-a-beton-les-consomma…
- S33Standards for reinforcement. The Concrete Centre (UK).concretecentre.com/Codes/European-standards-for-reinforcement.aspx
- S78ISO 9001:2015 Quality management systems, Requirements. ISO, 2015.iso.org
Cite this chapter
Cameroon Steel (2026). Safer buildings need rebar that meets its declared grade. White paper 10, chapter 5: A mill proves quality with statistics and traceability, not with single tests. CS-WP-10. https://www.cameroon-steel.com/en/library/quality-steel/testing-and-quality-control/
Source