White paper 02 · Chapter 8
Successful port-industrial zones built infrastructure ahead of demand and organised around anchors
The port-industrial zones that have become regional platforms share four traits. A single authority controlled both the port and the land around it; infrastructure, especially power, water and berths, was delivered ahead of or alongside the first tenants; one or more anchor industries arrived early and pulled suppliers in after them; and policy pushed raw materials towards local processing. Tanger Med, Jebel Ali, Jurong and Lekki illustrate the general model; Sohar and Pecém show how steel itself has been organised at deep-water ports; Nkok in Gabon, developed by one of KPIZ’s shareholders, shows the model working in Central Africa. They also carry warnings: success took one to five decades, and where gas or power was not planned for industry, downstream ambitions stalled. Kribi has the first trait in KPIZ and the beginnings of the second; the steel cluster can supply the third.
In this chapter (9)
- 8.1 Why look abroad
- 8.2 Tanger Med: one authority for port and zones
- 8.3 Jebel Ali: the heavy anchor came first
- 8.4 Jurong: plan the cluster and its corridors
- 8.5 Lekki: deep water and a mega-tenant in West Africa
- 8.6 Steel at deep-water ports: Sohar and Pecém
- 8.7 Nkok: the model of a KPIZ shareholder in Central Africa
- 8.8 What the benchmarks do not show
- 8.9 What the benchmarks mean for Kribi
8.1 Why look abroad
Benchmarks do not prove that Kribi will succeed; the conditions of each zone are specific. They are useful for two purposes. They show what the elements of a successful port-industrial platform are, and in what order they were put in place. And they give orders of magnitude, for land, firms, jobs and time, against which Kribi’s plans can be tested. The selection here mixes general port-industrial zones (Tanger Med, Jebel Ali, Jurong, Lekki), steel-specific port clusters (Sohar, Pecém) and an African zone developed by one of KPIZ’s own shareholders (Nkok). Figure 8.1 places their main milestones on a single time line.
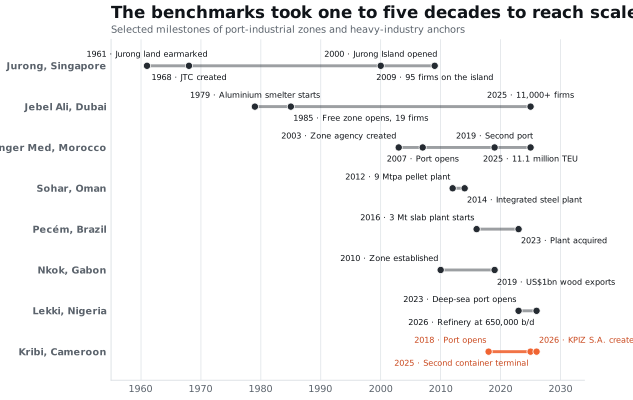
Source: National Library Board, Singapore [S126]; Ministry of Trade and Industry, Singapore, 2009 [S125]; Emirates Global Aluminium [S124]; Khaleej Times, 2025 [S123]; Wikipedia (tertiary, background dates only) and Morocco World News for Tanger Med dates [S132][S133]; Tanger Med Port Authority, 2026 [S121]; CCSI, 2016 [S127]; ArcelorMittal, 2023 [S128]; AllAfrica, 2024 and Africa Finance Corporation [S130][S129]; Lekki Port [S120]; Tekedia, 2026 [S131]; Kribi sources [S117][S57][S02].
8.2 Tanger Med: one authority for port and zones
Tanger Med, on Morocco’s Strait of Gibraltar coast, is the clearest African example of a port and industrial zones planned and run together. A special agency was created in 2003 to develop the port and its zones [S132] (tertiary); the first port opened in 2007 and a second, Tanger Med 2, was inaugurated in June 2019, taking container capacity above 9 million TEU [S133]. In 2025 the port complex handled 11,106,164 TEU and 161 Mt of cargo [S121]. Its economic zones extend over about 3,000 ha and host more than 1,500 companies with about 145,000 jobs; industrial business volume reached about US$18.8 billion in 2025, of which automotive accounted for about US$12.5 billion [S122].
The anchor was a car plant. In 2025 the port exported 327,569 vehicles from Renault’s plants at Melloussa and Casablanca and 126,874 from Stellantis’s plant at Kenitra [S121]. The automotive cluster then pulled in component suppliers, logistics and services.
The lesson for Kribi is about governance more than cargo. Tanger Med is not a heavy-bulk port: its dry-bulk traffic was only about 0.5 Mt in 2025 [S121]. What it shows is the value of a single authority that plans port capacity, land, utilities and investor services together and markets them as one product, which is the model that KPIZ’s Director General has been described as wanting to replicate at Kribi [S134].
8.3 Jebel Ali: the heavy anchor came first
Jebel Ali in Dubai is now best known for its free zone, JAFZA, which grew from 19 companies when it opened in 1985 to more than 11,000 companies from 157 countries by 2025 [S123]. The heavy-industry story came before the free zone. The Jebel Ali aluminium smelter, now part of Emirates Global Aluminium (EGA), began production in 1979 with three potlines and 135,000 t a year of capacity, and after eight expansions has a nameplate capacity of about 1 Mt a year [S124]. It has its own power station of 2,974 MW, a desalination plant producing about 136,000 m³ of water a day, and two dedicated berths at Jebel Ali Port for its raw-material imports [S124].
The lesson for Kribi is direct. A power-intensive anchor with its own power, water and berths came first, and the wider free zone grew around the infrastructure it justified. Kribi will not replicate a smelter’s captive power plant, but the principle that the anchor’s utilities and berths should be planned at the scale of the anchor, and then shared, is the same.
8.4 Jurong: plan the cluster and its corridors
Singapore’s industrial development began in 1961, when about 6,500 ha of land at Jurong was recommended for industrial development; the Jurong Town Corporation (JTC) was created in 1968 to develop it [S126]. The country’s chemicals cluster was later concentrated on Jurong Island, created by reclaiming land between seven southern islands and opened in 2000 [S126]. When reclamation was completed in 2009, the island had grown from less than 1,000 ha to about 3,000 ha and hosted 95 energy and chemical companies with more than S$31 billion of fixed assets [S125].
What made Jurong Island effective was integration. The responsible minister described a cluster in which upstream plants supply feedstock to downstream manufacturers and companies share common facilities; when one tenant expanded, the authorities realigned a stretch of the island’s highway together with 17 pipelines and four fibre-optic cables to accommodate it [S125]. The lesson for Kribi is that corridors for pipes, conveyors and cables, and adjacency between complementary tenants, have to be planned before plots are allocated (Chapter 7).
8.5 Lekki: deep water and a mega-tenant in West Africa
Lekki, east of Lagos, is the closest benchmark in geography and timing. The Lekki Deep Sea Port, owned by China Harbour Engineering Company, the Tolaram group, the Lagos State Government and the Nigerian Ports Authority, has been fully operational since 1 April 2023, with container, dry-bulk and liquid-bulk terminals [S120]. Nearby, in the Lekki Free Zone, the Dangote refinery reached its full capacity of 650,000 barrels a day in a single train in early 2026, on about 2,500 ha [S131].
Lekki shows what a deep-water port and a very large tenant can do for a coastal zone in a few years. It also shows a dependency: very large tenants have often had to provide their own supporting infrastructure where public provision could not keep pace, as EGA’s captive power station at Jebel Ali illustrates [S124]. A steel cluster at Kribi is far smaller than a 650,000 barrel-a-day refinery, and should not need to do the same, provided the zone’s power, water and berths keep pace.
8.6 Steel at deep-water ports: Sohar and Pecém
Two benchmarks show how steel itself has been organised around deep-water ports.
Sohar, Oman. Sohar developed a steel and iron-ore cluster in its industrial port and free zone. Vale commissioned a pelletising plant of 9 Mt a year, in two lines of 4.5 Mt, in early 2012, together with a distribution centre for 40 Mt of iron ore and a dedicated deep-water terminal about 1.5 km long; a case study for Columbia University’s Center on Sustainable Investment noted that Sohar was the only deep-water port in the Gulf states able to receive very large ore carriers [S127]. Jindal Shadeed operates gas-based direct-reduction plants of 1.5 and 1.8 Mt a year and commissioned an integrated steel plant of about 2 Mt a year in 2014 [S127]. The same study warned that poor planning had led to shortages of natural gas, which limited the strategy of downstream diversification [S127].
Pecém, Brazil. The Companhia Siderúrgica do Pecém in Ceará, commissioned in 2016, has a blast furnace of about 3 Mt a year of slab capacity linked by conveyors to the deep-water Port of Pecém about 10 km away, and operates within Brazil’s first export processing zone; ArcelorMittal completed its acquisition in March 2023 at an enterprise value of about US$2.2 billion [S128]. Pecém shows the value of a dedicated conveyor link between quay and plant, and of a legal regime that lets an export-oriented plant operate competitively.
The cautionary side of the steel record is also instructive. Midrex’s statistics list idle direct-reduction plants in Africa, including Delta Steel at Warri in Nigeria and ArcelorMittal South Africa’s plant at Saldanha [S101]. Steel plants at the coast fail when their inputs, power or markets fail, not because the coast is wrong.
8.7 Nkok: the model of a KPIZ shareholder in Central Africa
The Gabon Special Economic Zone at Nkok, near Libreville, was established in 2010 as a public-private partnership between the government of Gabon and Arise IIP, which is now a shareholder of KPIZ [S130][S04]. It covers about 1,126 ha across three sites and hosts 144 companies from 17 countries in 22 sectors, with more than 20,000 jobs [S130]. Its wood cluster made Gabon Africa’s leading exporter of tropical veneer; the Africa Finance Corporation reports that wood-product exports rose from about US$350 million in 2010 to about US$1 billion in 2019 [S129][S130].
The policy behind Nkok is the closest analogue to Kribi’s steel ambition. Gabon restricted exports of raw logs to push processing into the country, and the zone gave processors the land, power and services to respond [S129]. Cameroon’s Mining Code, which requires mining conventions to provide for at least 15% of production to be made available for local transformation [S24], creates a comparable policy push for iron ore. KPIZ, with Arise IIP among its shareholders, has direct access to the experience of delivering a zone that answered such a push.
Table 8.1 sourcedBenchmark port-industrial zones compared
| Zone | Country | Key dates | Scale | Anchor | Infrastructure lesson | Source |
|---|---|---|---|---|---|---|
| Tanger Med | Morocco | Agency 2003; port 2007; second port 2019 | 161 Mt and 11.1 million TEU (2025); about 3,000 ha of zones; 1,500+ firms; about 145,000 jobs | Car assembly (Renault) | One authority for port, zones and investor services | [S121][S122][S132][S133] |
| Jebel Ali and JAFZA | United Arab Emirates | Smelter 1979; free zone 1985 | 11,000+ firms (2025); smelter about 1 Mtpa | Aluminium smelter with 2,974 MW captive power | Anchor’s power, water and berths came first | [S123][S124] |
| Jurong and Jurong Island | Singapore | 1961; JTC 1968; island 2000 | About 3,000 ha island; 95 firms; S$31bn+ fixed assets (2009) | Refining and petrochemicals | Integrated cluster planning; shared facilities and corridors | [S125][S126] |
| Lekki | Nigeria | Port operational 2023 | Refinery of 650,000 b/d on about 2,500 ha | Oil refinery | Deep water attracts a mega-tenant; tenant self-supply when public infrastructure lags | [S120][S131] |
| Sohar | Oman | Pellet plant 2012; steel plant 2014 | 9 Mtpa pellets; 40 Mt ore depot; DRI 1.5 and 1.8 Mtpa | Iron ore and steel | Dedicated deep-water terminal; gas shortage limited downstream growth | [S127] |
| Pecém | Brazil | Steel plant 2016 | About 3 Mtpa slab | Integrated steel plant | Conveyor link to a deep-water port; export processing zone | [S128] |
| Nkok | Gabon | 2010 | About 1,126 ha; 144 firms; 20,000+ jobs | Wood processing | Policy push for local processing plus zone delivery | [S129][S130] |
Source: as listed; figures are those reported by the sources and are not independently audited.
8.8 What the benchmarks do not show
The comparisons have limits that should be stated plainly. Jebel Ali and Sohar were built on cheap and plentiful Gulf gas; Kribi’s gas is available but its long-term volume is uncertain [S69]. Singapore and Morocco combined their zones with strong state capacity and very large markets within a few days’ shipping; Central Africa’s markets are smaller and its land transport slower. Tanger Med’s anchor was car assembly, not heavy industry, and its dry-bulk traffic is small [S121]. Several of the figures quoted are operators’ own statements and are not independently audited.
None of this weakens the main lessons, which concern sequence and organisation rather than scale. It does mean that Kribi should be judged against its own trajectory, by whether each enabling step arrives on time, and not against the absolute size of zones that have had decades to grow.
8.9 What the benchmarks mean for Kribi
Table 8.2 derivedLessons from the benchmarks and their implications for a Kribi steel platform
| Lesson | Where it was learned | Implication for Kribi |
|---|---|---|
| One authority should plan port capacity, land, utilities and investor services together | Tanger Med | Give KPIZ a clear mandate and a single investor interface; complete the PAK to KPIZ transition quickly |
| Size utilities and berths to the anchor, then share them | Jebel Ali | Plan the second power stage, water and a steel-cluster berth to the steel anchor’s needs |
| Plan corridors and adjacency before allocating plots | Jurong Island | Reserve pipe, conveyor and cable corridors; place steel, slag, gases and cement next to each other |
| A dedicated quay-to-plant link pays | Sohar, Pecém | Plan private haul roads or covered conveyors between the bulk berth and the steel cluster |
| Gas must be planned for industry, not left over | Sohar | Decide early how much of Kribi’s gas can be committed to industry after July 2026 |
| Policy can push raw materials into local processing, if the zone is ready to receive them | Nkok | Align the Mining Code’s local-transformation requirement with serviced land and power at Kribi |
| Scale takes decades | All | Judge Kribi on sequence and momentum, not on its first five years |
Source: Cameroon Steel analysis of the benchmarks above.
Sources cited in this chapter
Bracketed markers refer to these sources; the full list is in the annex. Full list of sources
- S126Jurong reclamation (Infopedia article). National Library Board, Singapore, 2010.eresources.nlb.gov.sg/infopedia/articles/SIP_1076_2010-05-14.html
- S125Speech by Mr Lim Hng Kiang at the Jurong Island reclamation completion ceremony. Ministry of Trade and Industry, Singapore, 25 September 2009.mti.gov.sg/newsroom/mr-lim-hng-kiang-at-the-jurong-island-reclamation-…
- S124Jebel Ali smelter (operations page). Emirates Global Aluminium.ega.ae/en/about-us/operations/jebel-ali
- S123Dubai: Jafza marks 40 years. Khaleej Times, 5 May 2025.khaleejtimes.com/business/dubai-jafza-40-year-anniversary
- S132Tanger Med (encyclopaedia entry; background dates of creation and port openings only) (tertiary). Wikipedia.en.wikipedia.org/wiki/Tanger_Med
- S133Tanger Med 2: Morocco inaugurates port extension (Crown Prince inaugurates Tanger Med 2, 28 June 2019). Morocco World News, 29 June 2019.moroccoworldnews.com/2019/06/79229/moroccan-port-mediterranean-tanger-…
- S121Port activity report in 2025: Tanger Med surpasses the 11 million containers mark (press release). Tanger Med Port Authority, 2 February 2026.tangermed.ma/wp-content/uploads/press-releases/2026/CP-TMPA-PORT-ACTIV…
- S127Downstream beneficiation case study: Oman (J. Talkin), CCSI policy paper. Columbia Center on Sustainable Investment, March 2016.ccsi.columbia.edu/sites/default/files/content/docs/our%20focus/Oman_Ir…
- S128ArcelorMittal completes acquisition of CSP in Brazil (press release). ArcelorMittal (via Euronext), 9 March 2023.live.euronext.com/en/products/equities/company-news/2023-03-09-arcelor…
- S130À Nkok, une zone économique moteur du dynamisme économique gabonais (partner content). AllAfrica (InfoWire), 1 June 2024.fr.allafrica.com/stories/202406030353.html
- S129The ARISE special economic zone model: value creation and development impact. Africa Finance Corporation, n.d..africafc.org/news-and-insights/insights/the-arise-special-economic-zon…
- S120Lekki Deep Sea Port: company website (terminals, shareholders, operations since 1 April 2023). Lekki Port LFTZ Enterprise.lekkiport.com/
- S131Dangote Petroleum Refinery hits full 650,000 bpd capacity in single-train milestone. Tekedia, 13 February 2026.tekedia.com/dangote-petroleum-refinery-hits-full-650000-bpd-capacity-i…
- S117Cameroun: malgré un bond de son activité, les bénéfices du port de Kribi chutent de 38% en 2023. EcoMatin, 2 July 2024.ecomatin.net/cameroun-malgre-un-bond-de-son-activite-les-benefices-du-…
- S57Cameroon’s Kribi port triples capacity with launch of second container terminal. Business in Cameroon, 12 May 2025.businessincameroon.com/infrastructures/1205-14650-cameroon-s-kribi-por…
- S02Lancement de la Kribi Port Industrial Zone: l’avenir a commencé. Port Autonome de Kribi, 26 February 2026.Cited by title and date
- S122Tanger Med industrial activity hits $18.8 billion in 2025. Morocco World News, 14 April 2026.moroccoworldnews.com/2026/04/286977/tanger-med-industrial-activity-hit…
- S134Yves Roger Melingui, l’homme qui veut répliquer le succès de Tanger Med au Cameroun. Jeune Afrique, 25 March 2026.jeuneafrique.com/1775106/economie-entreprises/yves-roger-melingui-lhom…
- S1012025 World Direct Reduction Statistics. Midrex Technologies, September 2026.midrex.com/world-dri-statistics/
- S04Port de Kribi: AGL, Arise IIP et Belmont s’allient au PAK pour une zone industrielle de 521 milliards FCFA sur 4 000 ha. Investir au Cameroun, 20 February 2026.investiraucameroun.com/gestion-publique/2002-23123-port-de-kribi-agl-a…
- S24Loi n° 2023/014 du 19 décembre 2023 portant Code minier (Article 40(4), local transformation). Republic of Cameroon (FAOLEX), 19 December 2023.faolex.fao.org/docs/pdf/cmr223180.pdf
- S69Cameroon’s SNH eyes Yoyo-Yolanda and new exploration blocks to sustain gas growth. Business in Cameroon, 6 July 2026.businessincameroon.com/energy/0607-16422-cameroon-s-snh-eyes-yoyo-yola…
Cite this chapter
Cameroon Steel (2026). Kribi can become Central Africa’s steel platform if infrastructure keeps pace. White paper 02, chapter 8: Successful port-industrial zones built infrastructure ahead of demand and organised around anchors. CS-WP-02. https://www.cameroon-steel.com/en/library/kribi-steel-platform/benchmarks/
Source