White paper 04 · Chapter 7
Demand could reach 0.7 to 1.2 Mt by 2040, and in every scenario the iron-unit gap widens
Cameroon’s apparent steel use, about 450 kt in 2025, rises to between 685 kt and 1,230 kt by 2040 in the three scenarios presented here, with a base case of about 920 kt [S01][S18]. The scenarios combine the World Bank’s population projection with three paths for steel use per person: almost flat (low), rising to the current average of the rest of Africa outside Egypt and South Africa (base), and rising to today’s average for Africa as a whole (high) [S02]. They are scenarios, not forecasts: they describe what the market would look like under stated assumptions, and they are deliberately simple so that every step can be checked. Two results hold in all three. Demand for sections and flat steel grows faster than demand for reinforcing bar, which even in the high case stays below the rebar capacity already installed. And the gap between the iron units that domestic mills need and the scrap the country generates widens, from about 170 kt today to between 225 kt and 520 kt a year by 2040.
In this chapter (8)
- 7.1 Why scenarios rather than a forecast
- 7.2 Method: population times steel use per person
- 7.3 Results: 685 kt, 920 kt or 1,230 kt in 2040
- 7.4 Product mix: sections and flat steel grow fastest
- 7.5 The iron-unit gap widens in every scenario
- 7.6 Cross-checks against other indicators
- 7.7 The regional envelope
- 7.8 What would move the outcome up or down
7.1 Why scenarios rather than a forecast
A point forecast of Cameroonian steel demand to 2040 would claim more precision than the evidence allows. There is no official series of apparent steel use from which to estimate trends or elasticities; the 450 kt starting point is an industry estimate [S01]. The population base is under revision after the provisional census count of 22.7 million, about 24% below the estimates used by international institutions [S15]. Product-level trade data stop in 2023 [S05]. Public investment, which drives a large share of construction, depends on a fiscal position the IMF rates as carrying a high risk of debt distress [S36].
Scenarios address these uncertainties honestly. Each is defined by one transparent assumption, the growth of steel use per person, applied to a published population projection. The range between the low and high cases is wide on purpose: it covers outcomes from fiscal stagnation to a sustained infrastructure push. The method, assumptions and ranges are set out in full in Annex A.
7.2 Method: population times steel use per person
Demand in each year is the World Bank’s projected population multiplied by steel use per person [S18]. Use per person starts at 15.06 kg in 2025, the industry estimate of 450 kt divided by 29.88 million people [S01][S14]. It then grows at a constant annual rate:
- Low scenario: 0.5% a year. Steel use per person barely moves, reaching 16.2 kg in 2040. Total demand grows with population only, at about 2.8% a year. This corresponds to prolonged fiscal constraint, slow private construction and no step change in infrastructure.
- Base scenario: 2.5% a year. Use per person reaches 21.8 kg in 2040, close to the 2025 average of the rest of Africa, 22.5 kg [S02]. Total demand grows at about 4.9% a year, slightly faster than construction value added has grown in recent years (4.3% in 2024 and 2025) and close to worldsteel’s near-term forecasts for Africa (3.8% in 2026 and 4.6% in 2027) [S16][S39].
- High scenario: 4.5% a year. Use per person reaches 29.1 kg in 2040, today’s average for Africa as a whole, 29.2 kg [S02]. Total demand grows at about 6.9% a year. This requires a sustained infrastructure and housing programme and a growing private industrial base; it remains far below the pace at which India raised its use per person, by 45% in four years between 2021 and 2025 [S02].
The three paths are anchored on observed benchmarks rather than on an assumed elasticity to GDP, because the data to estimate such an elasticity do not exist for Cameroon. The implied elasticity of steel demand to construction growth in the base case is a little above one (4.9% against 4.3%), which is typical of economies at an early stage of urbanisation, but it is a result of the scenario, not an input.
7.3 Results: 685 kt, 920 kt or 1,230 kt in 2040
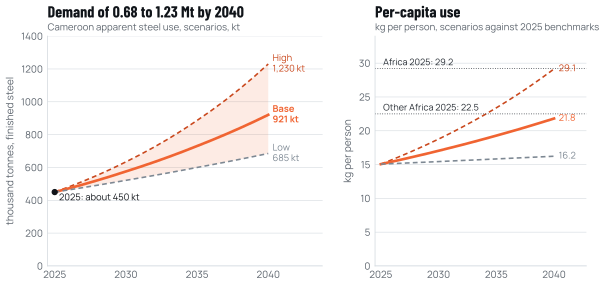
Source: Cameroon Steel scenarios; population from World Bank projections [S18]; starting point from industry estimate [S01]; benchmarks from worldsteel [S02]. Illustrative scenarios, not forecasts.
Table 7.1 illustrativeScenario results for Cameroon and the rest of CEMAC, 2025 to 2040
| Indicator | 2025 | 2030 | 2035 | 2040 | Growth a year, 2025 to 2040 |
|---|---|---|---|---|---|
| Population, Cameroon (million) | 29.9 | 33.8 | 37.9 | 42.2 | 2.3% |
| Apparent steel use, low (kt) | 450 | 522 | 600 | 685 | 2.8% |
| Apparent steel use, base (kt) | 450 | 576 | 731 | 921 | 4.9% |
| Apparent steel use, high (kt) | 450 | 634 | 886 | 1,230 | 6.9% |
| Steel use per person, low / base / high (kg) | 15.1 | 15.4 / 17.0 / 18.8 | 15.8 / 19.3 / 23.4 | 16.2 / 21.8 / 29.1 | 0.5% / 2.5% / 4.5% |
| Reinforcing bar, base (kt) | 180 | 225 | 278 | 341 | 4.4% |
| Sections and structures, base (kt) | 50 | 68 | 90 | 120 | 6.0% |
| Flat steel, base (kt) | 95 | 123 | 159 | 203 | 5.2% |
| Iron-unit gap for long products, low / base / high (kt) | 174 | 192 / 222 / 255 | 209 / 281 / 367 | 226 / 353 / 521 | |
| Rest of CEMAC, chapter 72 envelope, low / base / high (kt, midpoint) | about 240 | 380 / 510 / 680 | 3.1% / 5.1% / 7.2% |
Source: Cameroon Steel scenarios (Annex A). Population from World Bank projections [S18]; 2025 product split derived from Ocitram demand data and UN Comtrade import tonnages [S03][S05]; rest of CEMAC from UN Comtrade values at an assumed US$700 to 900 per tonne [S06]. Status: illustrative.
In the base case, demand reaches about 576 kt in 2030 and 731 kt in 2035. The difference between the low and high cases in 2040, about 545 kt, is larger than today’s entire market, which shows how much depends on policy and investment. A useful way to read the range is that every percentage point of annual growth in use per person changes 2040 demand by about 15% (derived).
The population assumption matters less than it appears. If the final census confirms a population near 22.7 million, the starting point for use per person rises to about 20 kg, but the starting tonnage, 450 kt, does not change, because it is estimated from production and trade rather than from population [S15][S01]. Demand growth would then depend on the growth rate of the smaller population, which the census has not yet published. Annex A discusses this sensitivity.
7.4 Product mix: sections and flat steel grow fastest
The scenarios project total demand. To see where the gaps lie, total demand must be divided by product. The 2025 split used here is built from industry and trade data: 180 kt of reinforcing bar and 38 kt of wire rod, wire and nails (Ocitram’s demand figures), about 95 kt of flat steel and about 50 kt of sections and structures (2023 import tonnages), about 25 kt of tubes, and about 62 kt of other finished steel, the residual [S03][S05]. These are estimates; Annex A gives their derivation.
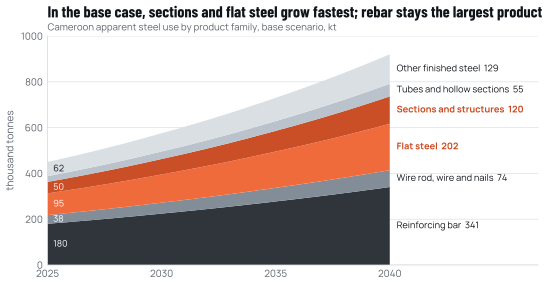
Source: Cameroon Steel scenarios. 2025 split derived from Ocitram and UN Comtrade data [S03][S05]; 2040 shares assumed (Annex A).
For the future split, this paper assumes that shares move gradually towards a 2040 mix with somewhat less reinforcing bar (37% against 40% today) and more sections and structures (13% against 11%) and flat steel (22% against 21%). The assumption reflects the shift of the infrastructure pipeline towards rail, ports, power and mining, and the growth of industrial buildings, described in Chapter 3. On this basis, in the base case:
- reinforcing bar grows from 180 kt to about 341 kt (4.4% a year);
- sections and structures grow from 50 kt to about 120 kt (6.0% a year);
- flat steel grows from about 95 kt to about 203 kt (5.2% a year);
- wire rod, wire and nails grow from 38 kt to about 74 kt;
- tubes and hollow sections grow from about 25 kt to about 55 kt.
7.5 The iron-unit gap widens in every scenario
Reinforcing bar, wire rod and light sections are rolled in Cameroon from billets, which are either imported or melted locally from scrap. The second key output of the scenarios is therefore the volume of iron units that domestic long-product rolling will need, compared with the scrap the country can supply.
The calculation is simple (Annex A). The iron units needed, in billet equivalent, are the domestic demand for reinforcing bar and wire products, plus half of the demand for sections and structures (the share assumed to be light sections rolled locally), plus exports of about 31 kt a year, divided by a billet-to-product yield of 0.95. Local scrap starts at about 108 kt in 2023, the figure implied by the 40% share reported by industry (Chapter 5), and is assumed to grow by 3% a year as the country’s steel stock grows. The gap is the difference, which today is met by imported billets.
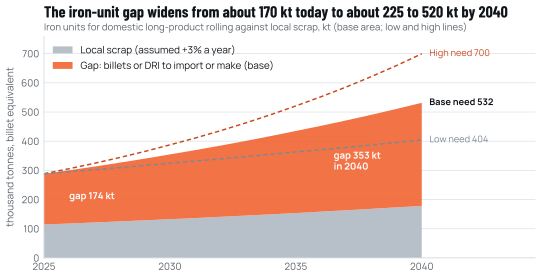
Source: Cameroon Steel scenarios, derived from Figure 7.2, a billet-to-product yield of 0.95 and an assumed 3% annual growth of local scrap (Annex A); starting scrap volume derived from industry data and UN Comtrade [S03][S20][S05].
The starting value is a useful check. The model gives a 2025 gap of about 174 kt; actual billet imports were 161.4 kt in 2023, and chapter 72 tonnage rose further in 2025 [S05][S07]. In 2040 the gap reaches about 226 kt in the low case, 353 kt in the base case and 521 kt in the high case. Even doubling the assumed growth of scrap, to 6% a year, would leave a base-case gap of about 240 kt in 2040 (derived). In other words, scrap cannot close the gap, and on present policy the country’s dependence on imported iron units grows with its economy.
This is the central quantitative result of the paper. The gap that a new producer can fill without displacing existing domestic capacity is not in finished bars; it is in iron units, in the range of about 170 kt today rising to roughly 225 to 520 kt by 2040, plus the heavy sections and flat steel that are not made in Cameroon at all.
7.6 Cross-checks against other indicators
Three independent indicators can be used to test whether the scenarios are reasonable.
The first is trade. Cameroon’s chapter 72 import tonnage grew from 182,890 t in 2019 to 412,049 t in 2025, about 14.5% a year (derived) [S19][S07]. That rate is much faster than any of the scenarios, but it overstates the growth of steel use, because it includes the shift from imported finished products to imported billets that domestic mills roll, and possibly stock-building in 2025. It nevertheless shows that the market can absorb rapid increases in supply when prices fall.
The second is cement, and it does not settle the question. Cameroon’s reported cement demand of about 6.8 Mt in 2025 would be about 15 times its estimated steel use, and domestic cement output of about 4.7 Mt about 10 times, against a world ratio of about 2.2 [S103][S105][S109][S02] (derived). A ratio this high is not explained by the construction mix alone; it more likely means that cement demand is overstated, that steel use is understated, or both. The bottom-up check of Chapter 3, which gives roughly 410 to 570 kt of apparent steel use in 2025, points the same way. This paper therefore treats the ratio as unresolved (Chapter 11) and uses cement only for direction: clinker imports grew 20.5% in 2025, consistent with the strong rise in steel imports the same year [S07].
The third is the African benchmark. worldsteel’s forecasts for Africa, 3.8% growth in 2026 and 4.6% in 2027, and the 27.5% increase in use in the rest of Africa between 2021 and 2025 bracket the base scenario’s 4.9% a year [S39][S02]. The low scenario, at 2.8% a year, is below Africa’s recent performance and corresponds to a period of stagnation; the high scenario, at 6.9%, is above it but well below the rates achieved by fast-industrialising economies such as India [S02].
7.7 The regional envelope
The same approach can be applied, indicatively, to the other CEMAC members. Their chapter 72 imports were worth about US$191m in 2023; at an assumed US$700 to 900 per tonne, this is roughly 210 to 270 kt, with a midpoint of about 240 kt (Chapter 6) [S06]. Their combined population is projected to grow from 37.5 million to 55.0 million between 2025 and 2040, a factor of 1.47 [S18]. Applying the same three paths for use per person gives a 2040 envelope of about 380 kt (low), 510 kt (base) or 680 kt (high) at the midpoint (derived; range in Annex A).
Adding Cameroon’s own base case, regional steel demand, measured as Cameroon’s apparent use plus the neighbours’ import envelope, would be roughly 1.4 Mt in 2040, against about 0.7 Mt today (derived). This regional figure is the least certain number in the paper: it rests on values rather than tonnages, on an assumed average price and on the assumption that neighbours’ use per person grows like Cameroon’s. It is shown to indicate scale, not to support investment decisions.
7.8 What would move the outcome up or down
The scenarios are driven by one parameter, but the real economy offers several levers and risks.
Upward pressure would come from faster execution of the infrastructure pipeline in Table 3.1, particularly the steel-intensive elements: railways, port terminals, transmission lines, hydropower and mine infrastructure. Mining projects in the 2026 to 2030 iron-ore programme, if they proceed, would add demand for structures, plate and rail during construction [S72]. Lower imported steel prices would also raise demand at the margin, since steel is a significant share of building costs for households.
Downward pressure would come from fiscal consolidation, payment arrears to contractors, higher interest rates or a shortage of foreign exchange, all of which are present in the current outlook [S36][S113][S76]. A sharp rise in world steel prices, for example if trade defence elsewhere were relaxed or Chinese export licensing tightened supply, would also slow demand in a price-sensitive market.
Policy can change the product mix more than the total. Standards for structural steel, procurement rules that specify certified products, and trade measures that address import surges in specific products (Chapter 10) would determine how much of the growing demand for sections and iron units is met domestically. The scenarios show the size of the market; the next chapters examine how prices and policy determine who supplies it.
Sources cited in this chapter
Bracketed markers refer to these sources; the full list is in the annex. Full list of sources
- S01Cameroun: Prometal décroche 26,2 milliards FCFA d’Afreximbank. Camer.be, 1 Oct 2026.camer.be/actualites/economie/cameroun-prometal-decroche-262-milliards-…
- S15Cameroun: bouclage du 4e RGPH, 22,7 millions d’habitants recensés. Journal du Cameroun, 5 Oct 2026.fr.journalducameroun.com/cameroun-bouclage-du-4e-rgph-227-millions-dha…
- S05UN Comtrade public API, Cameroon (reporter 120), HS 72/73 and 6-digit lines, 2019-2023. UN Statistics Division.comtradeapi.un.org/public/v1/preview/C/A/HS?reporterCode=120&period=20…
- S36IMF staff concludes Post-Financing Assessment mission to Cameroon (PR 26/314). IMF, 1 Oct 2026.imf.org/en/news/articles/2026/10/01/pr26314-imf-staff-concludes-assesm…
- S18Population estimates and projections (source 40): SP.POP.TOTL and SP.URB.TOTL.IN.ZS, 2025 to 2040. World Bank, updated 1 Jul 2026.api.worldbank.org/v2/country/CMR/indicator/SP.POP.TOTL?source=40&forma…
- S14WDI API: SP.POP.TOTL; SP.URB.TOTL.IN.ZS (CMR). World Bank, updated 8 Oct 2026.api.worldbank.org/v2/country/CMR/indicator/SP.POP.TOTL?format=json
- S02World Steel in Figures 2026 (page and PDF). worldsteel, 4 Jun 2026.worldsteel.org/data/world-steel-in-figures/world-steel-in-figures-2026…
- S16Les Comptes Nationaux de 2025. INS Cameroun, Aug 2026 (posted 2 Sep 2026).ins-cameroun.cm/wp-content/uploads/2026/09/Comptes_Nationaux_2025_FR_V…
- S39worldsteel Short Range Outlook April 2026 (release + Table 1). worldsteel, 14 Apr 2026.worldsteel.org/media/press-releases/2026/worldsteel-short-range-outloo…
- S03Production: les acteurs en présence. Cameroon Tribune, 11 May 2026.cameroon-tribune.cm/article.html/76600/fr.html/details_2
- S06UN Comtrade public API, CEMAC & Nigeria (reporters 266 Gabon, 178 Congo, 140 CAR, 566 Nigeria; mirror partners 148 Chad, 226 Eq. Guinea). UN Statistics Division.comtradeapi.un.org/public/v1/preview/C/A/HS?reporterCode=266&period=20…
- S20Cameroun: le groupe Prometal décroche 26 milliards FCFA auprès d’Afreximbank…. Sikafinance, 30 Sep 2026.sikafinance.com/marches/cameroun-le-groupe-prometal-decroche-26-millia…
- S07Évolution du commerce extérieur en 2025 (version provisoire). INS Cameroun, Feb 2026 (posted 1 Apr 2026).ins-cameroun.cm/wp-content/uploads/2026/04/Note-sur-le-commerce-exteri…
- S19Commerce extérieur du Cameroun en 2020. INS Cameroun, Jul 2021.ins-cameroun.cm/wp-content/uploads/2025/07/Note-Commerce-exterieur-202…
- S103Cameroun: le ghanéen Empire Cement veut implanter une cimenterie d’1 Mt à Douala. EcoMatin, 6 Aug 2025.ecomatin.net/cameroun-le-ghaneen-empire-cement-veut-implanter-une-cime…
- S105L’industrie camerounaise du ciment face à des défis structurels. EcoMatin, 29 Sep 2025.ecomatin.net/lindustrie-camerounaise-du-ciment-face-a-des-defis-struct…
- S109Mineral Commodity Summaries 2026: Cement. U.S. Geological Survey, Jan 2026.pubs.usgs.gov/periodicals/mcs2026/mcs2026-cement.pdf
- S72Cameroon plans $3.1B iron ore push starting 2026. Daba Finance (republished by AllAfrica), 14 Feb 2026.dabafinance.com/en/news/cameroon-mining-investment-2026-2030
- S113Zone Cémac: la BEAC annonce un ralentissement de croissance à 2,4%. AllAfrica (Les Dépêches de Brazzaville), 17 Dec 2025.fr.allafrica.com/stories/202512170629.html
- S76Cameroon targets 476 km of new roads in 2026 infrastructure plan. Business in Cameroon, 16 Feb 2026.businessincameroon.com/construction/1602-15761-cameroon-targets-476-km…
Cite this chapter
Cameroon Steel (2026). Cameroon’s steel gap lies in iron units, not in rebar. White paper 04, chapter 7: Demand could reach 0.7 to 1.2 Mt by 2040, and in every scenario the iron-unit gap widens. CS-WP-04. https://www.cameroon-steel.com/en/library/market-outlook/scenarios/
Source