白皮书06 · 第3章 · 中文摘要
电网排放因子:喀麦隆水电是电弧炉钢厂最大的优势
本章结论:喀麦隆电力以水电为主,碳强度在非洲处于较低水平。按2024年平均值约226克二氧化碳当量/千瓦时计,电网用电使RC-1一期每吨产品增加约0.22吨二氧化碳;同一电弧炉和轧机若接入全球平均电网约为0.45吨,接入南非电网约为0.69吨。
本页为本章中文摘要;英文全文附于其后,可展开阅读。
RC-1一期满负荷年用电约2.89亿千瓦时,即每吨成品约960千瓦时,约占喀麦隆2025年发电量(81.2亿千瓦时)的3.6%;全部建成后约为7.53亿千瓦时[S90][S50]。2024年水电占发电量约72%;420兆瓦的纳赫蒂加尔水电站于2025年3月全面投运后,2025年水电占比约90%[S49][S50]。据此推算的2025年电网平均值约为74至96克/千瓦时(指示性),因此226克/千瓦时的规划值相对平均值偏保守,但相对边际排放因子并不保守。电弧炉电耗规划值为450千瓦时/吨钢水,含30%直接还原铁炉料时约490千瓦时/吨为规划上限值,此时一期年用电约3.02亿千瓦时,碳强度约增加0.01吨(推算);电弧炉可按系统高峰调整熔炼时间,属于可调度负荷而非可中断负荷,熔炼时段需要稳定供电(白皮书05第2章和第3章详述电力系统)。
电网排放因子每变化100克/千瓦时,一期每吨产品排放约变化0.096吨;当电网排放因子约为343克/千瓦时,RC-1总强度即与全球废钢电弧炉平均值0.69吨持平。但平均值并非全部:旱季或输电受限时,边际电源可能是克里比燃气电厂,其排放率约为770克/千瓦时,在此类时段一期每吨约多排放0.5吨(推算)。因此,签订有明确低碳电源、旱季稳定供电的合同,是继工艺路线之后最有价值的碳决策。
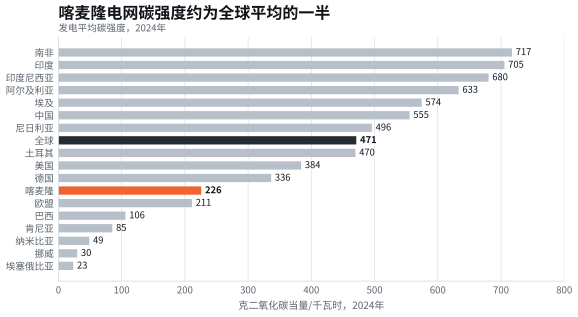
资料来源:Ember,经Our World in Data,发电碳强度,2026年10月10日访问[S48]。
英文全文 11分钟 · 2555词The grid factor: Cameroon’s hydropower is the electric works’ largest advantage
Cameroon’s electricity is among the lower-carbon supplies in Africa because most of it comes from hydropower. At the 2024 average of about 226 g CO2e/kWh, grid electricity adds about 0.22 t of CO2 to each tonne of RC-1 Phase 1 product; on the world-average grid the same furnace and mills would add about 0.45 t, and on South Africa’s grid about 0.69 t. The 2025 generation mix, with Nachtigal fully online, points to an even lower average. The advantage is real, but it is an average: it holds only if the works can draw firm power through the dry season without pulling thermal plants onto the margin.
3.1 An electric works is mostly an electricity consumer
RC-1 Phase 1 would use about 289 GWh of electricity a year at nameplate output, or about 960 kWh per tonne of finished product (derived from the RC-1 reference configuration [S90]). Of this, the electric-arc furnace, ladle furnace and melt-shop auxiliaries take about 166 GWh (57%), induction heating of billets before rolling about 90 GWh (31%) and the rolling mills about 33 GWh (11%). The furnace planning value of 450 kWh per tonne of liquid steel sits inside the range of 347 to 500 kWh/t given by the IFC’s guidelines for steel mills [S20]; European melt shops report 404 to 748 kWh/t depending on charge and practice [S19]. Because DRI needs more energy to melt than scrap, about 14.5 kWh/t more for every 10 points of DRI in the charge [S15], about 490 kWh/t is the upper planning value for a charge with 30% DRI or HBI. At that value Phase 1 would use about 302 GWh a year and draw about 38 MW on average, and its Scopes 1 and 2 would rise by about 0.01 t per tonne (derived).
At full build-out to 1 Mtpa the annual demand would rise to about 753 GWh. Because Phases 2 and 3 are planned with gas-fired reheating, electricity use per tonne would fall to about 750 kWh, and part of the energy demand would move to natural gas (Chapter 4). In capacity terms, Phase 1 would draw an average of about 36 MW and the full works about 94 MW, with peaks well above these averages: an electric-arc furnace of the 40 t class, with a furnace transformer of the 30 to 33 MVA class, draws far more than the average while it melts [S90]. Because melting can be timed around system peaks, the furnace offers schedulable load, not interruptible load: it needs firm supply in the hours it melts.
Those volumes are material for Cameroon’s power system, which White paper 05 (Chapters 2 and 3) describes in full; this chapter keeps only what the carbon estimate needs. Total generation was 8,120 GWh in 2025, installed capacity 2,033 MW and peak demand 1,278 MW [S50]. RC-1 Phase 1 would therefore consume about 3.6% of 2025 generation, and the full works about 9% (derived). That is why the carbon content of the grid, and the firmness of supply, are central to any honest estimate of the works’ footprint.
Table 3.1 Cameroon’s power system and the RC-1 demand in context
| Item | Value | Year | Status | Source |
|---|---|---|---|---|
| Installed capacity | 2,033 MW, of which hydro 69.5% | 2025 | sourced | [S50] |
| Generation | 8,119.9 GWh, of which hydro 7,272.4 GWh | 2025 | sourced | [S50] |
| Peak demand | 1,278 MW | 2025 | sourced | [S50] |
| Nachtigal hydro | 420 MW, fully commissioned March 2025; 3.6 TWh injected in the 12 months to May 2026 | 2025 to 2026 | sourced | [S91][S52] |
| Industrial demand unmet pending the Nachtigal 400 kV evacuation line | 150 MW; line due November 2026 | October 2026 | sourced | [S51] |
| 225 kV supply to the Kribi port platform | 100 MW initially, 330 to 400 MW later | 2025 to 2026 | sourced | [S55][S56] |
| Hydro potential | about 115 TWh a year, about 4% developed | 2026 | sourced | [S53] |
| RC-1 Phase 1 electricity | about 289 GWh/yr; about 36 MW average | at nameplate | derived | [S90] |
| RC-1 full build-out electricity | about 753 GWh/yr; about 94 MW average | at nameplate | derived | [S90] |
Source: as listed. RC-1 averages assume 8,000 operating hours a year.
3.2 The grid average fell sharply as Nachtigal came online
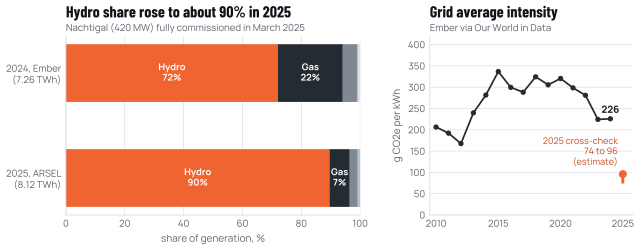
Figure 3.1 shows Cameroon’s generation mix and average carbon intensity. On the Ember dataset published through Our World in Data, hydro supplied about 5.23 TWh of 7.26 TWh in 2024 (72%), gas 1.60 TWh, oil 0.35 TWh and solar and bioenergy small amounts; the average intensity was 225.9 g CO2e/kWh, close to 224 g in 2023 and down from 281 g in 2022 [S48][S49]. The regulator ARSEL’s 2025 report shows a very different mix: 8.12 TWh generated, of which 7.27 TWh (about 90%) was hydro and only about 0.78 TWh came from gas and oil [S50]. The difference reflects the full commissioning of the 420 MW Nachtigal plant in March 2025, which delivered about 2.07 TWh in 2025 despite hydrology below plan [S50].
Source: Ember via Our World in Data, carbon intensity and generation by source [S48][S49]; ARSEL, Rapport d’activités 2025 [S50]; life-cycle factors for hydro (24 g), solar (48 g) and bioenergy (230 g) from IPCC AR5 Annex III [S58]. 2025 cross-check derived by Cameroon Steel (Annex A).
No 2025 value has yet been published on the Ember basis. To gauge where it might fall, we derived the average emission rate of fossil generation implied by the 2024 data (about 770 g CO2e/kWh, consistent with gas engines and oil-fired plants) and applied it to the 2025 fossil generation reported by ARSEL. The result, an estimate of about 74 to 96 g/kWh depending on whether hydro and solar are counted at zero or at their life-cycle values, is less than half the 2024 average. We treat it as an indicative cross-check, not a replacement: the two datasets have different coverage, 2025 hydrology was not exceptional, and a single year does not make a trend. The planning value in this paper remains the published 226 g/kWh, which is therefore conservative against the average. It is not conservative against the marginal factor discussed below.
3.3 Cameroon’s grid is about half as carbon-intensive as the world’s
Figure 3.2 places Cameroon among other electricity systems. Its 2024 average of 226 g/kWh is close to the European Union’s 211 g and well below the world’s 471 g, China’s 555 g, India’s 705 g and South Africa’s 717 g [S48]. Several African systems with large hydro or geothermal shares, such as Ethiopia, Kenya and Namibia, are lower still.
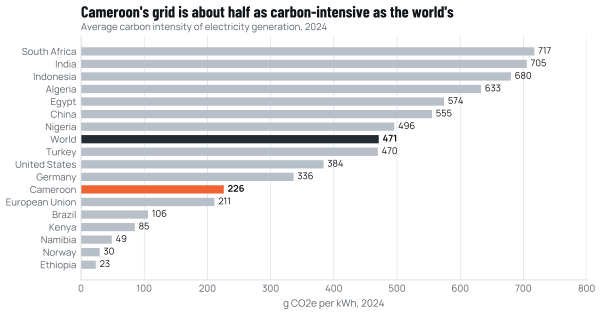
Source: Ember via Our World in Data, carbon intensity of electricity generation, accessed 10 October 2026 [S48].
For a steel melt shop this ranking translates directly into carbon per tonne. The largest steel-producing countries run their electric furnaces on grids of 400 to 700 g/kWh, which is one reason why the world scrap-EAF average of 0.69 t per tonne is far above what the same technology achieves on hydro or nuclear grids.
3.4 The same melt shop on another grid would lose most of its advantage
Figure 3.3 holds everything about RC-1 Phase 1 constant except the grid factor. At 226 g/kWh, Scopes 1 and 2 come to about 0.32 t per tonne of product and the total including imported DRI to about 0.58 t. At the world average of 471 g/kWh these become about 0.56 and 0.81 t; on China’s grid about 0.64 and 0.90 t; on South Africa’s about 0.80 and 1.05 t (derived). The RC-1 total would match the world scrap-EAF average of 0.69 t at a grid factor of about 343 g/kWh.
Each 100 g/kWh of grid factor is worth about 0.096 t of CO2 per tonne of Phase 1 product, because the works uses about 960 kWh per tonne. That slope is the quantitative case for treating power as a climate decision. A 100 g/kWh difference in the average carbon intensity of supplied electricity is worth more than every furnace-efficiency measure in Chapter 10 combined.
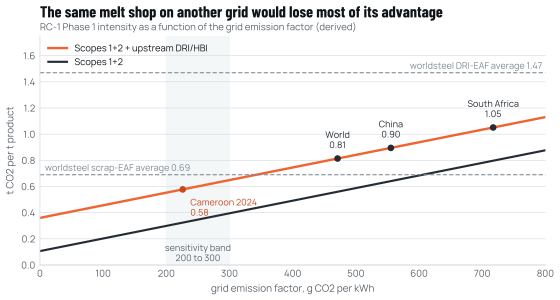
Source: WP06 model on the Cameroon Steel reference configuration RC-1 (planning estimate) [S90]; grid factors from Ember via Our World in Data [S48]; worldsteel route averages [S01].
Table 3.2 Grid factor cases for the RC-1 footprint (t CO2 per tonne of product)
| Case | Grid factor, g/kWh | Phase 1, Scopes 1+2 | Phase 1, incl. upstream DRI | 1 Mtpa, Scopes 1+2 | 1 Mtpa, incl. upstream DRI | Status |
|---|---|---|---|---|---|---|
| Market-based, hydro contract (combustion basis) | 0 | 0.106 | 0.360 | 0.157 | 0.411 | illustrative |
| Hydro life-cycle factor (IPCC AR5 median) | 24 | 0.129 | 0.383 | 0.176 | 0.429 | illustrative |
| 2025 mix cross-check | 74 to 96 | 0.178 to 0.199 | 0.432 to 0.453 | 0.213 to 0.230 | 0.467 to 0.484 | derived |
| Low sensitivity | 200 | 0.299 | 0.553 | 0.308 | 0.562 | assumed |
| Planning value, 2024 average | 226 | 0.324 | 0.578 | 0.328 | 0.582 | derived |
| High sensitivity | 300 | 0.395 | 0.649 | 0.383 | 0.637 | assumed |
| World average, 2024 | 471 | 0.560 | 0.814 | 0.512 | 0.766 | illustrative |
| Fossil generation rate implied by 2024 data | about 770 | 0.849 | 1.103 | 0.738 | 0.992 | illustrative |
Source: WP06 model on the Cameroon Steel reference configuration RC-1 (planning estimate) [S90]; Ember via Our World in Data [S48]; ARSEL [S50]; IPCC AR5 Annex III [S58].
3.5 Average, marginal and contracted factors answer different questions
The grid average is the right factor for a location-based Scope 2 inventory under the GHG Protocol [S45], and it is the factor used in this paper’s central estimate. It is not the only relevant one.
The marginal factor. A new 36 to 94 MW load does not draw an average slice of the grid; it is served by whichever plant adjusts to meet it. In a hydro-dominated system with spare water, that is hydro and the marginal emissions are close to zero. In the dry season, or when transmission constraints bind, it may be the Kribi gas plant or oil-fired units, and the marginal factor approaches the fossil rate of about 770 g/kWh implied by the 2024 data. The 225 kV line that will supply the Kribi port platform runs from the Kribi gas plant’s substation [S55], and Business in Cameroon reported on 9 October 2026 that 150 MW of industrial demand was unmet pending the 400 kV evacuation line from Nachtigal [S51]. Until that line and the wider southern grid are reinforced, there is a real risk that new industrial load in Kribi is served at the margin by gas. In the hours when it is, Phase 1 would carry about 0.5 t more CO2 per tonne than at the 226 g/kWh average (derived), more than its whole Scope 2 at the average. Multilateral lenders often use a "combined margin" factor that blends the average and marginal views for project accounting; the harmonised factor for Cameroon could not be verified for this paper and is listed as an evidence gap (Chapter 11).
The contracted factor. A bilateral supply contract with an identified hydro plant, metered and matched in time, would support a market-based Scope 2 close to zero. On a grid that is already mostly hydro, such a claim is credible only if it does not simply reassign existing low-carbon output from other customers. The strongest form is a contract that brings new capacity onto the system, for example by underwriting part of a new hydro project or a firming arrangement, so that the works’ demand is matched by additional low-carbon supply.
The seasonal factor. Cameroon’s southern grid depends on rivers whose flows vary by season and year. Nachtigal delivered about 28% less than planned in 2025 because of hydrology [S50]. A steelworks that runs continuously will draw power in the dry months too. Reporting the grid factor monthly, and contracting for firmness, is therefore more informative than an annual average.
3.6 Firmness and cost shape what is achievable
Low-carbon power is valuable to a steelworks only if it is firm and affordable. White paper 05 (Chapter 3) analyses tariffs and contracting for large users; two points matter for carbon. There is no regulated tariff above 10 MW, so a works of RC-1’s size would contract bilaterally; legacy high-voltage contracts averaged about 18.4 FCFA/kWh in 2025, while the regulator estimates the cost-reflective average across all customers at about 105 FCFA/kWh [S50][S54]. Where a new steelworks lands in that range will affect both its competitiveness and the carbon content of the electricity it can secure, since cheaper supply is often older hydro whose output is already committed.
These constraints are not reasons to abandon the hydro advantage; they are reasons to plan for it deliberately. Chapter 10 recommends a power strategy built on four elements: a firm bilateral contract with identified low-carbon generation; support for the transmission reinforcements that bring hydro to Kribi; on-site measures (power-factor correction, flicker compensation, melting scheduled around system peaks and flexibility in the rolling mills) that make the works a good grid citizen; and monthly reporting of location- and market-based Scope 2.
3.7 What the grid factor cannot do
Even a perfectly clean grid would not make RC-1’s steel near-zero. At a grid factor of zero, Phase 1 would still emit about 0.11 t per tonne directly and carry about 0.25 t of upstream emissions from the imported DRI in its charge, for a total of about 0.36 t. That is lower than any route average, but well above the IEA’s near-zero threshold for a plant with about 70% scrap, which is about 0.16 t per tonne of crude steel [S06]. Beyond the grid, the next gains must come from the iron units and from direct emissions in the furnace. Chapter 4 sets out the full footprint and shows which of these matters most.
Other sources cited in the English text
- S20Environmental, Health, and Safety Guidelines for Integrated Steel Mills. IFC / World Bank Group, 30 Apr 2007.ifc.org/content/dam/ifc/doc/2000/2007-integrated-steel-mills-ehs-guide…
- S19Best Available Techniques Reference Document for Iron and Steel Production (EUR 25521). European Commission, Joint Research Centre, 2013.bureau-industrial-transformation.jrc.ec.europa.eu/sites/default/files/…
- S15ENERGIRON technology: DRI-EAF production route using natural gas or H2. European Commission, Innovation Centre for Industrial Transformation, ref. 12 Feb 2026.innovation-centre-for-industrial-transformation.ec.europa.eu/innovativ…
- S91Cameroon country profile. International Hydropower Association.hydropower.org/country-profiles/cameroon
- S52Énergie: Nachtigal franchit le cap des 3,6 TWh injectés dans le réseau en un an. Journal du Cameroun, 15 Jun 2026.fr.journalducameroun.com/energie-nachtigal-franchit-le-cap-des-36-twh-…
- S51Nachtigal power line delays leave 150 MW of industrial demand unmet. Business in Cameroon, 9 Oct 2026.businessincameroon.com/public-management/0910-16939-nachtigal-power-li…
- S55Kribi franchit la ligne électrique 225 kV (communiqué). Port Autonome de Kribi, 6 Aug 2025.Cited by title and date
- S56Énergie et infrastructures: un nouvel élan pour la compétitivité du Port de Kribi (communiqué). Port Autonome de Kribi, 19 Aug 2026.Cited by title and date
- S53Cameroon: Energy (Country Commercial Guide). US International Trade Administration, 13 Apr 2026.trade.gov/country-commercial-guides/cameroon-energy
- S58Climate Change 2014: Mitigation, Annex III: Technology-specific cost and performance parameters. IPCC Working Group III, 2014.ipcc.ch/site/assets/uploads/2018/02/ipcc_wg3_ar5_annex-iii.pdf
- S01Sustainability Indicators 2025 report (2024 data; route table added February 2026). worldsteel, Nov 2025; upd. Feb 2026.worldsteel.org/wider-sustainability/sustainability-indicators/
- S45GHG Protocol Corporate Standard (2004) and Scope 2 Guidance (2015). World Resources Institute and WBCSD, 2004; 2015.ghgprotocol.org/corporate-standard
- S54Décision fixant le montant de la RMA ENEO au titre de l’exercice 2025 (réajustée). ARSEL, 19 Dec 2025.arsel-cm.org/wp-content/uploads/2026/01/Decision-fixant-le-Montant-de-…
- S06Achieving Net Zero Heavy Industry Sectors in G7 Members. International Energy Agency, 19 May 2022.iea.blob.core.windows.net/assets/c4d96342-f626-4aea-8dac-df1d1e567135/…
本章引用的资料来源
方括号内的标记对应以下来源(按原文语言列出),完整列表见附录。 完整来源列表
- S90Cameroon Steel reference configuration RC-1 (planning estimate): phases, planning values, balances and indicative schedule, edition 10 October 2026. Cameroon Steel,2026年10月10日.按标题和日期引用
- S50Rapport d’activités 2025 de l’ARSEL. ARSEL (electricity regulator, Cameroon),2026年9月7日.arsel-cm.org/wp-content/uploads/2026/09/Rapport-ARSEL-2025.pdf
- S49Electricity production by source (Ember and Energy Institute data). Our World in Data,数据集访问于2026年10月10日.ourworldindata.org/grapher/electricity-prod-source-stacked
- S48Carbon intensity of electricity generation (Ember data). Our World in Data,数据集访问于2026年10月10日.ourworldindata.org/grapher/carbon-intensity-electricity
引用本章
Cameroon Steel(2026)。喀麦隆低碳钢铁:碳强度有望降至全球平均的三分之一左右(中文摘要版)。白皮书06,第3章:电网排放因子:喀麦隆水电是电弧炉钢厂最大的优势。CS-WP-06。https://www.cameroon-steel.com/zh/library/lower-carbon-steel/grid-factor/
来源