白皮书07 · 第4章 · 中文摘要
空气质量:空气流域已超过世卫组织细颗粒物指导值,钢铁厂必须将新增排放降至最低
克里比PM2.5模拟背景浓度约为10微克/立方米,是世界卫生组织2021年年均指导值的两倍。若现场监测予以证实,该空气流域即属“退化”,项目可占用的环境容量将缩减为最小增量。
本页为本章中文摘要;英文全文附于其后,可展开阅读。
喀麦隆没有空气质量监测网络。哥白尼大气监测服务(CAMS)2024至2025年再分析数据显示,克里比PM2.5年均背景浓度处于世卫组织第四个过渡目标水平,PM10约为15.8微克/立方米。其原因主要是哈马丹风沙尘和区域性生物质燃烧烟雾,而非工业。风主要来自海上,西南风占44.7%,南风占27.2%:白天海风将排放物吹向内陆,夜间陆风则可能将其吹向北部和西北部村庄,且风速较低,稀释能力有限。电弧炉的主要排放物为含锌和铅的粉尘、二噁英和一氧化碳,均可通过成熟技术控制:废钢入厂检查和辐射检测、第四孔一次除尘和密闭罩二次除尘、二次燃烧、急冷、活性炭和石灰喷射以及布袋除尘器。我们的设计目标为:粉尘低于5毫克/标准立方米,二噁英低于0.1纳克I-TEQ/标准立方米,项目对任一村庄PM2.5的贡献低于1.25微克/立方米,即指导值的25%。若评估表明该目标无法实现,我们将修改设计而非目标。在预测影响之前,我们将在厂址开展至少12个月的监测,并在线公布日均数据。
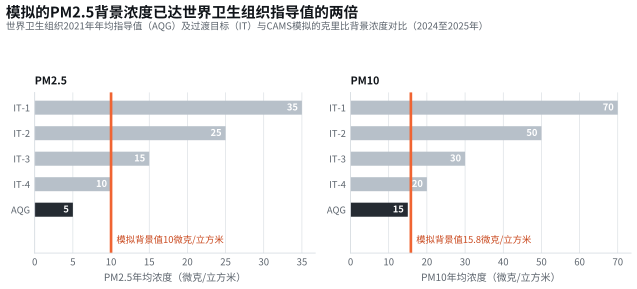
资料来源:世界卫生组织全球空气质量指南,2021年[G09];哥白尼CAMS全球再分析(经Open-Meteo),2024至2025年[E05]。模拟值,非实测值。
英文全文 11分钟 · 2571词Air quality: the airshed already exceeds the WHO fine-particle guideline, so the works must add as little as possible
Modelled background fine particulate matter (PM2.5) at Kribi is about 10 µg/m³, twice the WHO 2021 annual guideline of 5 µg/m³. The main causes are harmattan dust and smoke from regional biomass burning. If on-site monitoring confirms this, the airshed counts as degraded for fine particles under the World Bank Group General EHS Guidelines, and the project’s allowance shrinks to a minimal increment. The main air issues of an electric arc furnace (EAF) melt shop are dust carrying zinc and lead, dioxins and furans, and carbon monoxide. Fired reheating furnaces add nitrogen oxides, and stockyards and roads add fugitive dust. Proven techniques control all of them. Cameroon Steel’s design objective is the European best-available-technique level: dust below 5 mg/Nm³ and dioxins and furans below 0.1 ng I-TEQ/Nm³ at the melt-shop stack.
4.1 What the airshed looks like today
There is no air quality monitoring network in Cameroon. The environmental study for the Kribi gas power plant recorded this gap as early as 2007 [E06], and we found no evidence that it has since been filled near Kribi. The only measured data we found nearby come from that study. Diffusion tubes deployed at Mpolongwe, about 30 km north of Mboro, in April to June 2006 recorded sulphur dioxide (SO2) at 1.4 to 1.5 µg/m³ and ozone at 33.8 to 44.1 µg/m³. Nitrogen dioxide (NO2) was reported as far below World Bank and WHO values [E06]. The Multilateral Investment Guarantee Agency (MIGA) later reported that the plant’s 2012 monitoring complied with the applicable guidelines, without publishing the figures [E16]. These data are old, distant and short.
Modelled data fill part of the gap. The Copernicus Atmosphere Monitoring Service (CAMS) global reanalysis for the Kribi area in 2024 to 2025 gives the following annual means [E05]:
- PM10 15.8 µg/m³, with a 98th-percentile daily value of 49 µg/m³ and a daily maximum of 84 µg/m³;
- PM2.5 10.0 µg/m³, with a 98th-percentile daily value of 30 µg/m³;
- NO2 1.2 µg/m³;
- SO2 0.35 µg/m³;
- ozone 54 µg/m³.
Fine particles peak in January and February at 16.6 to 20.0 µg/m³ as monthly means, when harmattan dust reaches the coast. A second, smaller peak in June to August probably reflects smoke from biomass burning in southern Africa [E05]. Gaseous pollutants are low, as one would expect in a rural coastal area with little industry and modest traffic.
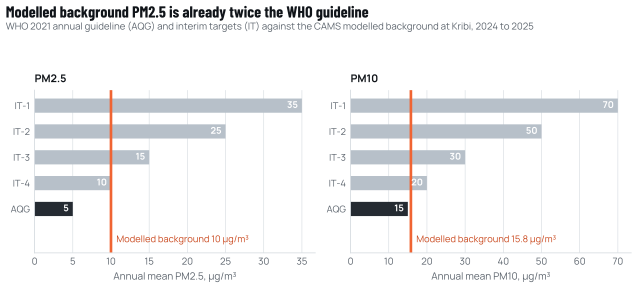
Source: WHO global air quality guidelines, 2021 [G09]; Copernicus CAMS global reanalysis via Open-Meteo, 2024 to 2025 [E05]. Modelled, not measured.
The comparison with the WHO guidelines is the most important fact in this chapter (Figure 4.1). The 2021 guidelines set annual mean levels of 5 µg/m³ for PM2.5 and 15 µg/m³ for PM10. They also set interim targets for countries working towards them: for PM2.5, 35, 25, 15 and 10 µg/m³ [G09]. On the modelled data, Kribi already sits at the last interim target for PM2.5. This is not caused by industry. It is the regional background of a tropical coast downwind of the Sahel and of Africa’s seasonal fire belt. But it changes the rules for any new source. The General EHS Guidelines ask a project to use no more than a quarter of the applicable ambient standard, and to keep its increment minimal where the airshed is already degraded [G04]. In Kribi, "applicable standard" should mean the WHO 2021 guideline, because Cameroon has adopted no national ambient standard.
Modelled data are not enough to decide the matter. CAMS resolves the atmosphere at a coarse grid and cannot see local sources such as unpaved roads, cooking fires or the port’s bulk handling. Before any impacts are predicted, we will run at least twelve months of on-site monitoring: reference-equivalent PM10 and PM2.5 monitors, passive tubes for gases and dust deposition gauges (Chapter 11).
4.2 Where the wind takes emissions
Kribi’s winds come mostly from the sea (Figure 4.2). In the modelled 2011 to 2020 series, south-westerly winds account for 44.7% of hours, southerlies for 27.2% and westerlies for 14.9% [E04]. By day, between late morning and evening, 92% of winds come from the south-west or west, a classic onshore sea breeze. At night a land-breeze component appears, and the wind backs to the south and south-east [E04]. The port authority’s observations confirm the predominance of south to south-westerly winds [E07].
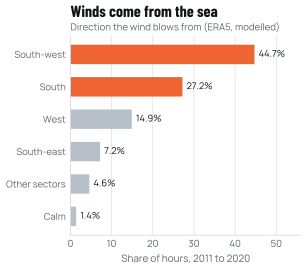
This pattern is broadly favourable but not benign. By day, the sea breeze carries stack and fugitive emissions towards the east-north-east, inland and away from the coastal villages. At night, southerly and south-easterly flows can carry them towards the north and north-west, where Boussibelika, Mbodé, Nlendé Dibé and the Eboundja villages lie. Wind speeds are low: the modelled mean is 2.3 m/s and the 95th percentile only 3.8 m/s [E04]. Low winds mean weak dilution, especially on still nights when the lower atmosphere is stable and plumes from low sources stay near the ground. That is why fugitive dust from stockyards and roads, released close to the ground, can matter as much as the main stack.
These are modelled winds at a coarse grid. Local topography and the sea-land boundary shape the real flow at the site. An on-site weather station with a 10 m mast will start the assessment. It will provide at least a year of hourly data to drive the dispersion model, so that predicted concentrations at each village rest on measured meteorology.
4.3 What an EAF melt shop emits
An EAF melts a metallic charge of steel scrap and, in our planned configuration, imported direct-reduced or hot-briquetted iron. It does so with electric arcs, oxygen and injected carbon. It does not reduce iron ore with coke, so the coke-oven and sinter-plant emissions that dominate integrated steelworks are absent [G03]. The remaining emissions are well characterised:
- Primary fume. During melting, the furnace releases hot gas laden with dust. The dust contains iron oxides and, from galvanised and coated scrap, zinc, lead and cadmium. The gas also contains carbon monoxide from injected carbon and electrodes.
- Dioxins and furans. Polychlorinated dibenzo-p-dioxins and furans (PCDD/F) can form when scrap carries chlorinated plastics or oils. They can also re-form in the off-gas as it cools through roughly 450 to 200 °C, a process known as de novo synthesis.
- Secondary fume. Fume escapes at charging, tapping and in the ladle furnace, and is captured by a roof canopy or an enclosure around the furnace.
- Mercury. Small quantities come from scrap containing switches and lamps.
- Nitrogen oxides. Gas-fired reheating furnaces produce them. Our planned Phase 1 heats billets electrically by induction, so this source becomes significant only with the gas-fired reheating furnaces of later phases [X03]. Those furnaces will be designed to the EU level for new natural-gas furnaces, 200 mg/Nm³ or less at 3% oxygen [G16].
- Fugitive dust. Scrap and iron storage, slag handling, truck movements and wind erosion of open surfaces all release dust.
Benchmarks show the scale. The IFC EHS Guidelines give a controlled EAF particulate emission of about 0.02 kg per tonne and a PCDD/F range of 0.07 to 9 µg I-TEQ per tonne [G03]. The width of that range reflects scrap quality and gas-cleaning design more than anything else. Across all routes and all member plants, worldsteel’s 2024 sector averages were 0.32 kg of dust, 0.66 kg of nitrogen oxides and 0.64 kg of sulphur oxides per tonne of steel [T01]. An EAF works without sinter or coke ovens should sit well below those averages.
4.4 Controls that work
None of these emissions requires new technology to control. Figure 4.3 shows the standard off-gas train of a modern EAF melt shop, and the purpose of each step. The key design choices are made early: the capacity of the fume system, the layout of the scrap yard, the enclosure of the furnace and the size of the bag filter.
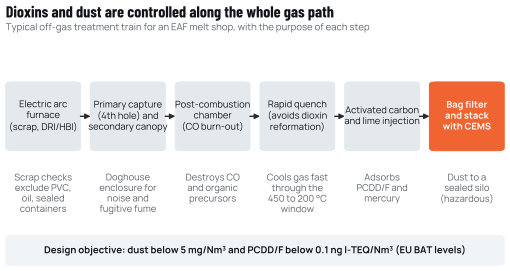
Source: IFC EHS Guidelines for Integrated Steel Mills [G03]; EU BAT conclusions for iron and steel, BAT 88 to 89 [G07]; Cameroon Steel design objectives (planned).
Control starts at the scrap gate. Most dioxin and metal emissions enter the furnace with the charge. We will inspect and grade incoming scrap. Loads containing PVC, oily residues, sealed containers or batteries will be rejected. Every load will pass a radiation portal monitor, because orphaned radioactive sources in scrap are a known risk worldwide. Directly reduced iron, which is clean and dense, also dilutes contaminants in the charge.
Capture is the second line. Primary fume will be drawn directly from the furnace roof (the "fourth hole"). Secondary fume will be collected by a canopy and, as a design objective, by a full enclosure around the furnace (a "doghouse"), which also reduces noise. The EU BAT conclusions associate capture efficiencies above 98% with good practice [G07].
Treatment is the third. The off-gas will pass through:
- a post-combustion chamber, which burns out carbon monoxide and organic precursors;
- a rapid quench, which cools the gas quickly through the temperature window in which dioxins re-form;
- injection of activated carbon and lime, which adsorbs residual dioxins and mercury;
- a fabric (bag) filter.
Bag filters on EAF melt shops routinely achieve dust concentrations below 5 mg/Nm³, the level the EU associates with best available techniques [G07]. The collected EAF dust is hazardous because of its metal content. It will go to sealed silos and be managed as described in Chapter 6.
Fugitive dust is controlled by housekeeping and design. Our measures include:
- covered storage for direct-reduced and hot-briquetted iron, which also prevents re-oxidation;
- paved and regularly cleaned internal roads;
- wheel washing at the exit;
- enclosed or covered conveyors;
- water sprays at slag handling;
- a green belt of native trees around the stockyards.
These measures are cheap and effective, but only if they are maintained, which is why they appear in the monitoring plan rather than only in the design.
4.5 Design objectives and monitoring
Table 4.1 sets out the air quality objectives we will carry into the assessment, the procurement specifications and the permit, together with how each will be verified. They are objectives for a plant that is not yet built. The assessment will test them, and they will be reported against once the plant operates.
Table 4.1 Air quality design objectives and monitoring plan (planned)
| Parameter | Design objective | How it will be verified |
|---|---|---|
| Melt-shop stack dust | Below 5 mg/Nm³ (daily mean) | Continuous emission monitoring system (CEMS); annual third-party calibration |
| PCDD/F at the melt-shop stack | Below 0.1 ng I-TEQ/Nm³ | Isokinetic sampling by an accredited laboratory twice a year for the first two years, then at least annually |
| Mercury and metals (zinc, lead, cadmium, chromium, nickel) | Mercury below 0.05 mg/Nm³; metals within IFC values | Quarterly isokinetic sampling in the first year, then half-yearly |
| Carbon monoxide and nitrogen oxides | EAF: CO at or below 100 mg/Nm³. Gas-fired reheating furnaces of later phases: NOx at or below 200 mg/Nm³ and CO at or below 50 mg/Nm³, at 3% O2 (EU BAT levels for new furnaces) | CEMS on the main stacks |
| Fume capture | Above 98% primary and secondary capture | Design verification at commissioning; visible-emission observations at each shift |
| Ambient PM10 and PM2.5 | Project contribution at any village below 25% of the WHO 2021 annual guideline (below 1.25 µg/m³ PM2.5 and 3.75 µg/m³ PM10) | Dispersion modelling with on-site meteorology; at least three continuous stations (upwind, downwind, nearest village) |
| Ambient NO2 and SO2 | No exceedance of the WHO 2021 guidelines attributable to the plant | Passive diffusion tubes at six or more points, monthly |
| Dust deposition and metals | No measurable increase over the pre-construction baseline at villages | Deposition gauges with monthly metal analysis |
| Dioxins in soil | No measurable increase over the pre-construction baseline | Baseline soil grid before construction, repeated every three years |
Source: IFC EHS Guidelines [G03][G04]; WHO 2021 [G09]; EU BAT conclusions [G07][G16]; Cameroon Steel objectives (planned), subject to the assessment and to permit conditions.
The contribution objective in the sixth row deserves explanation. The General EHS Guidelines’ rule of thumb is to use no more than 25% of the applicable standard [G04]. We apply it to the WHO 2021 guideline itself, not to an interim target, because the background already exceeds the guideline. If the assessment shows that this objective cannot be met at a village with the planned controls, we will change the design rather than the objective. The options include taller stacks, more enclosure and a different layout of stockyards and roads.
We will publish the monitoring results, as described in Chapter 10. Continuous emission data are only credible if others can see them. Our objective is to publish daily averages of stack dust and ambient PM2.5 online, with quarterly summaries in plain language, in French and English.
4.6 Noise, light and odour
Noise is the most local of the air-borne nuisances. An EAF is loud at source, as are scrap handling, oxygen plant compressors and rolling mill operations. The General EHS Guidelines set off-site limits of 55 dB(A) by day and 45 dB(A) at night at residential receptors. They also limit the increase over background to 3 dB at the nearest receptor [G04]. With the nearest mapped village about 3 to 4 km away, compliance is likely with ordinary attenuation and design. But "likely" is not a baseline. No measured noise data exist for Mboro or the port’s surroundings, so we will measure 24-hour levels at six to eight receptors in both the dry and the wet season before predicting impacts.
Our design measures follow standard practice:
- an enclosure around the furnace;
- silencers on fans;
- earth berms planted with trees along the site boundary facing the villages;
- no drop-ball scrap breaking or night-time scrap unloading near the boundary.
Lighting matters for a different reason. Marine turtles nesting at Ebodjé and along the coast are sensitive to artificial light, which can disorient hatchlings. Our process units are inland and screened, but we will specify shielded, downward-facing, warm-spectrum lighting throughout. We will apply the same standard to any facility we use near the coast.
Odour is a minor issue for an EAF works without coke ovens. Occasional odours can arise from scrap contamination and slag handling. Both are covered by the scrap-gate controls and housekeeping described above, and by the grievance mechanism described in Chapter 8.
Twelve months of on-site weather and air quality monitoring before impacts are predicted. A melt-shop bag filter designed for below 5 mg/Nm³ of dust. Dioxin control by scrap inspection, post-combustion, rapid quench and activated carbon. Radiation screening of every scrap load. A project contribution at any village below a quarter of the WHO 2021 annual guideline for fine particles. Publication of stack and ambient data online.
Other sources cited in the English text
- E06Kribi Power Project, Environmental and Social Impact Assessment Addendum (gas reciprocating engines). Scott Wilson for AES SONEL (World Bank disclosure), Oct 2007.documents1.worldbank.org/curated/en/760181468239362187/txt/E18210v120E…
- E16Kribi Power Development Corporation, Environmental and Social Review Summary. Multilateral Investment Guarantee Agency, 2014.miga.org/project/kribi-power-development-corporation
- G04Environmental, Health, and Safety (General) Guidelines. IFC / World Bank Group, 30 Apr 2007.ifc.org/content/dam/ifc/doc/2000/2007-general-ehs-guidelines-en.pdf
- E04ERA5 hourly reanalysis (precipitation, wind, temperature), accessed through the Open-Meteo historical weather API. ECMWF; Open-Meteo.open-meteo.com/en/docs/historical-weather-api
- E07Guide du Port de Kribi. Port Autonome de Kribi, Aug 2020.Cited by title and date
- G03Environmental, Health, and Safety Guidelines for Integrated Steel Mills. IFC / World Bank Group, 30 Apr 2007.ifc.org/content/dam/ifc/doc/2000/2007-integrated-steel-mills-ehs-guide…
- X03Cameroon Steel reference configuration RC-1 (planning estimate): planned capacities, phases, indicative schedule and benchmark-based estimates, edition of 10 October 2026. Cameroon Steel, 10 Oct 2026.Cited by title and date
- G16Commission Implementing Decision (EU) 2022/2110 establishing the best available techniques (BAT) conclusions for the ferrous metals processing industry (BAT 22, Table 1.9: feedstock heating in hot rolling). European Commission (Official Journal L 284, p. 69), 11 Oct 2022.eur-lex.europa.eu/legal-content/EN/TXT/HTML/?uri=CELEX:32022D2110
- T01Sustainability Indicators Report 2025 (2024 data). World Steel Association (worldsteel), Nov 2025 (updated Feb 2026).worldsteel.org/wider-sustainability/sustainability-indicators/
- G07Commission Implementing Decision 2012/135/EU establishing the best available techniques (BAT) conclusions for iron and steel production. European Commission, 28 Feb 2012.eur-lex.europa.eu/legal-content/EN/TXT/HTML/?uri=CELEX:32012D0135
本章引用的资料来源
方括号内的标记对应以下来源(按原文语言列出),完整列表见附录。 完整来源列表
- G09WHO global air quality guidelines: particulate matter (PM2.5 and PM10), ozone, nitrogen dioxide, sulfur dioxide and carbon monoxide. World Health Organization,2021年9月22日.who.int/publications/i/item/9789240034228
- E05CAMS global atmospheric composition reanalysis (PM10, PM2.5, NO2, SO2, O3, dust), accessed through the Open-Meteo air quality API. Copernicus Atmosphere Monitoring Service;Open-Meteo.open-meteo.com/en/docs/air-quality-api
引用本章
Cameroon Steel(2026)。在克里比负责任地建设:满足四项条件,钢铁厂即可达到国际标准(中文摘要版)。白皮书07,第4章:空气质量:空气流域已超过世卫组织细颗粒物指导值,钢铁厂必须将新增排放降至最低。CS-WP-07。https://www.cameroon-steel.com/zh/library/responsible-kribi/air-quality/
来源